Process
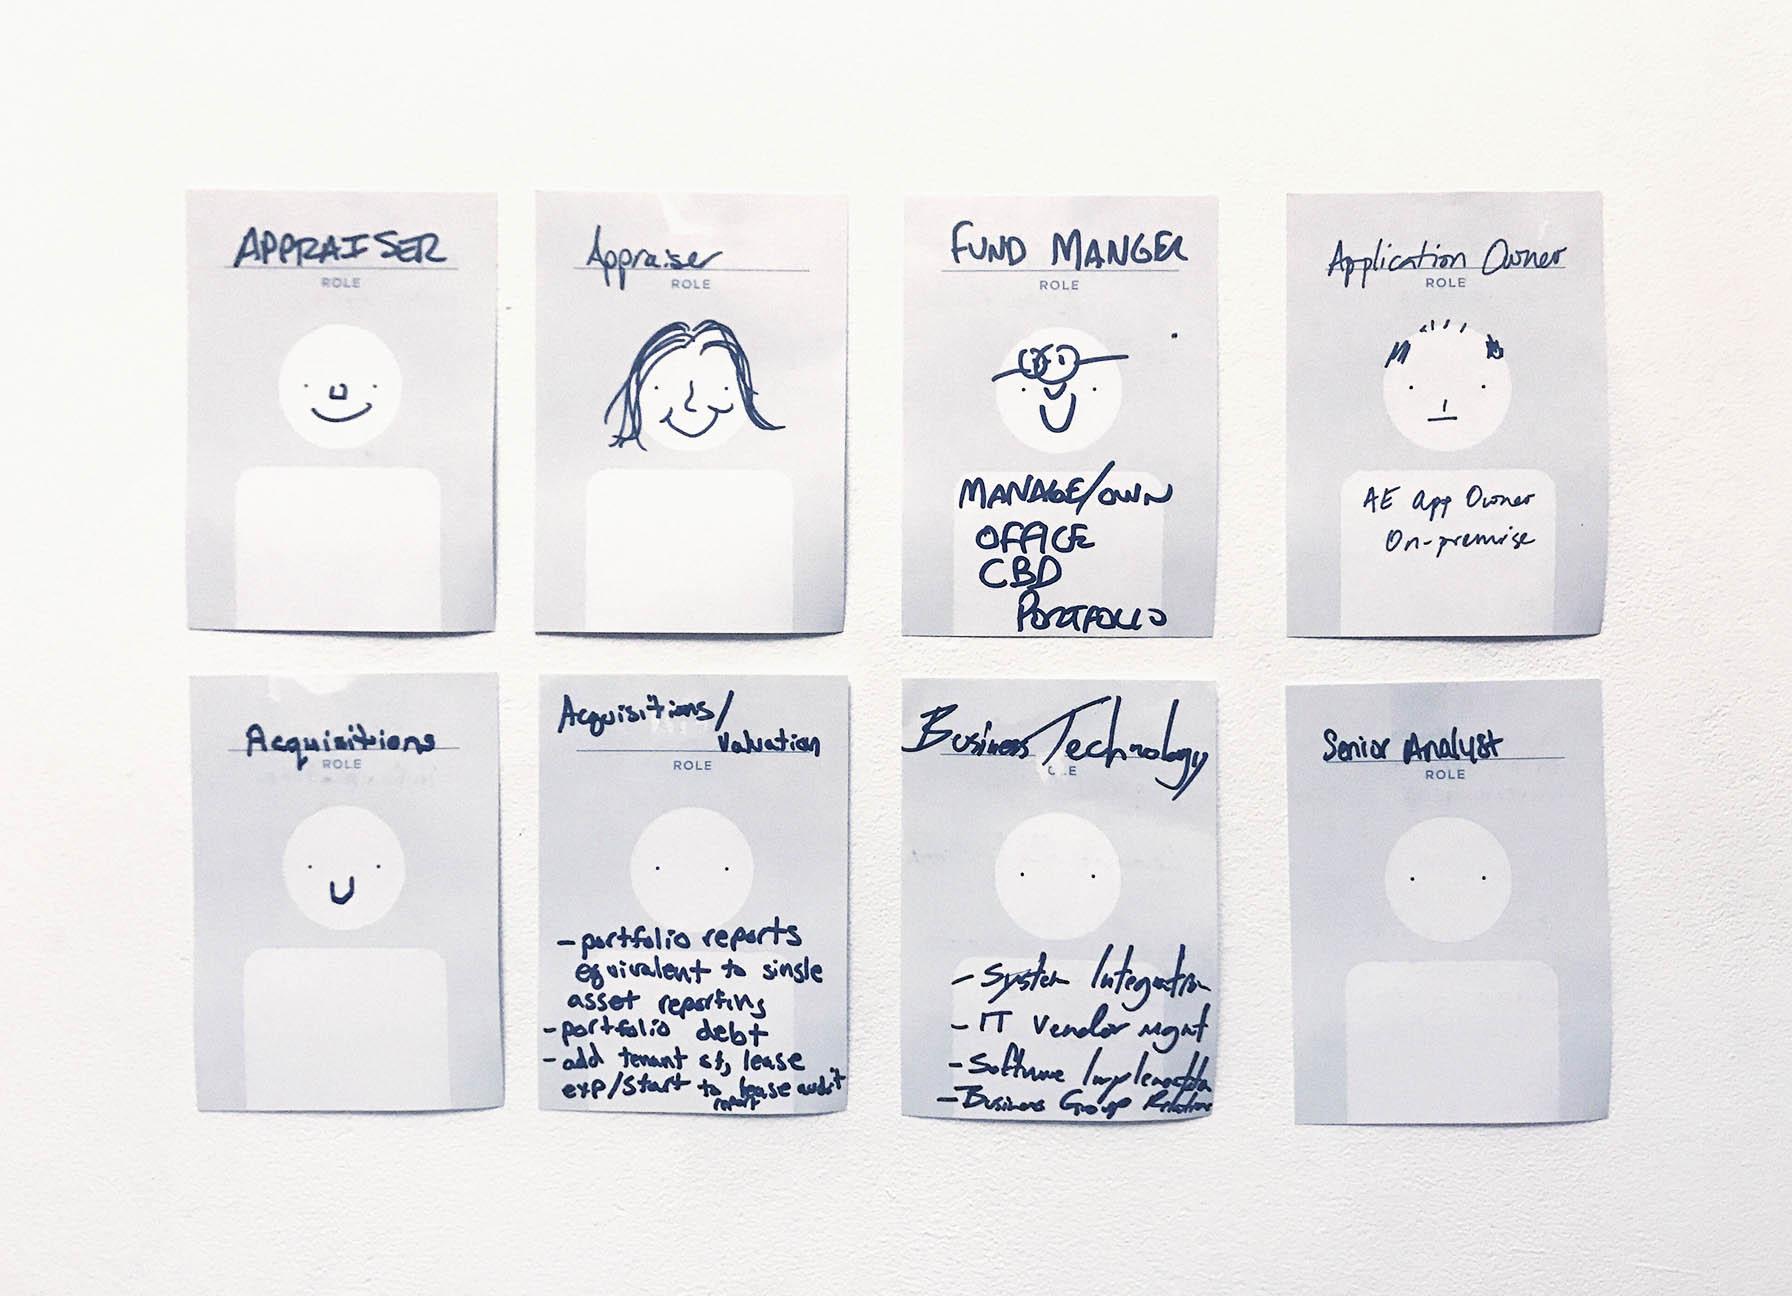
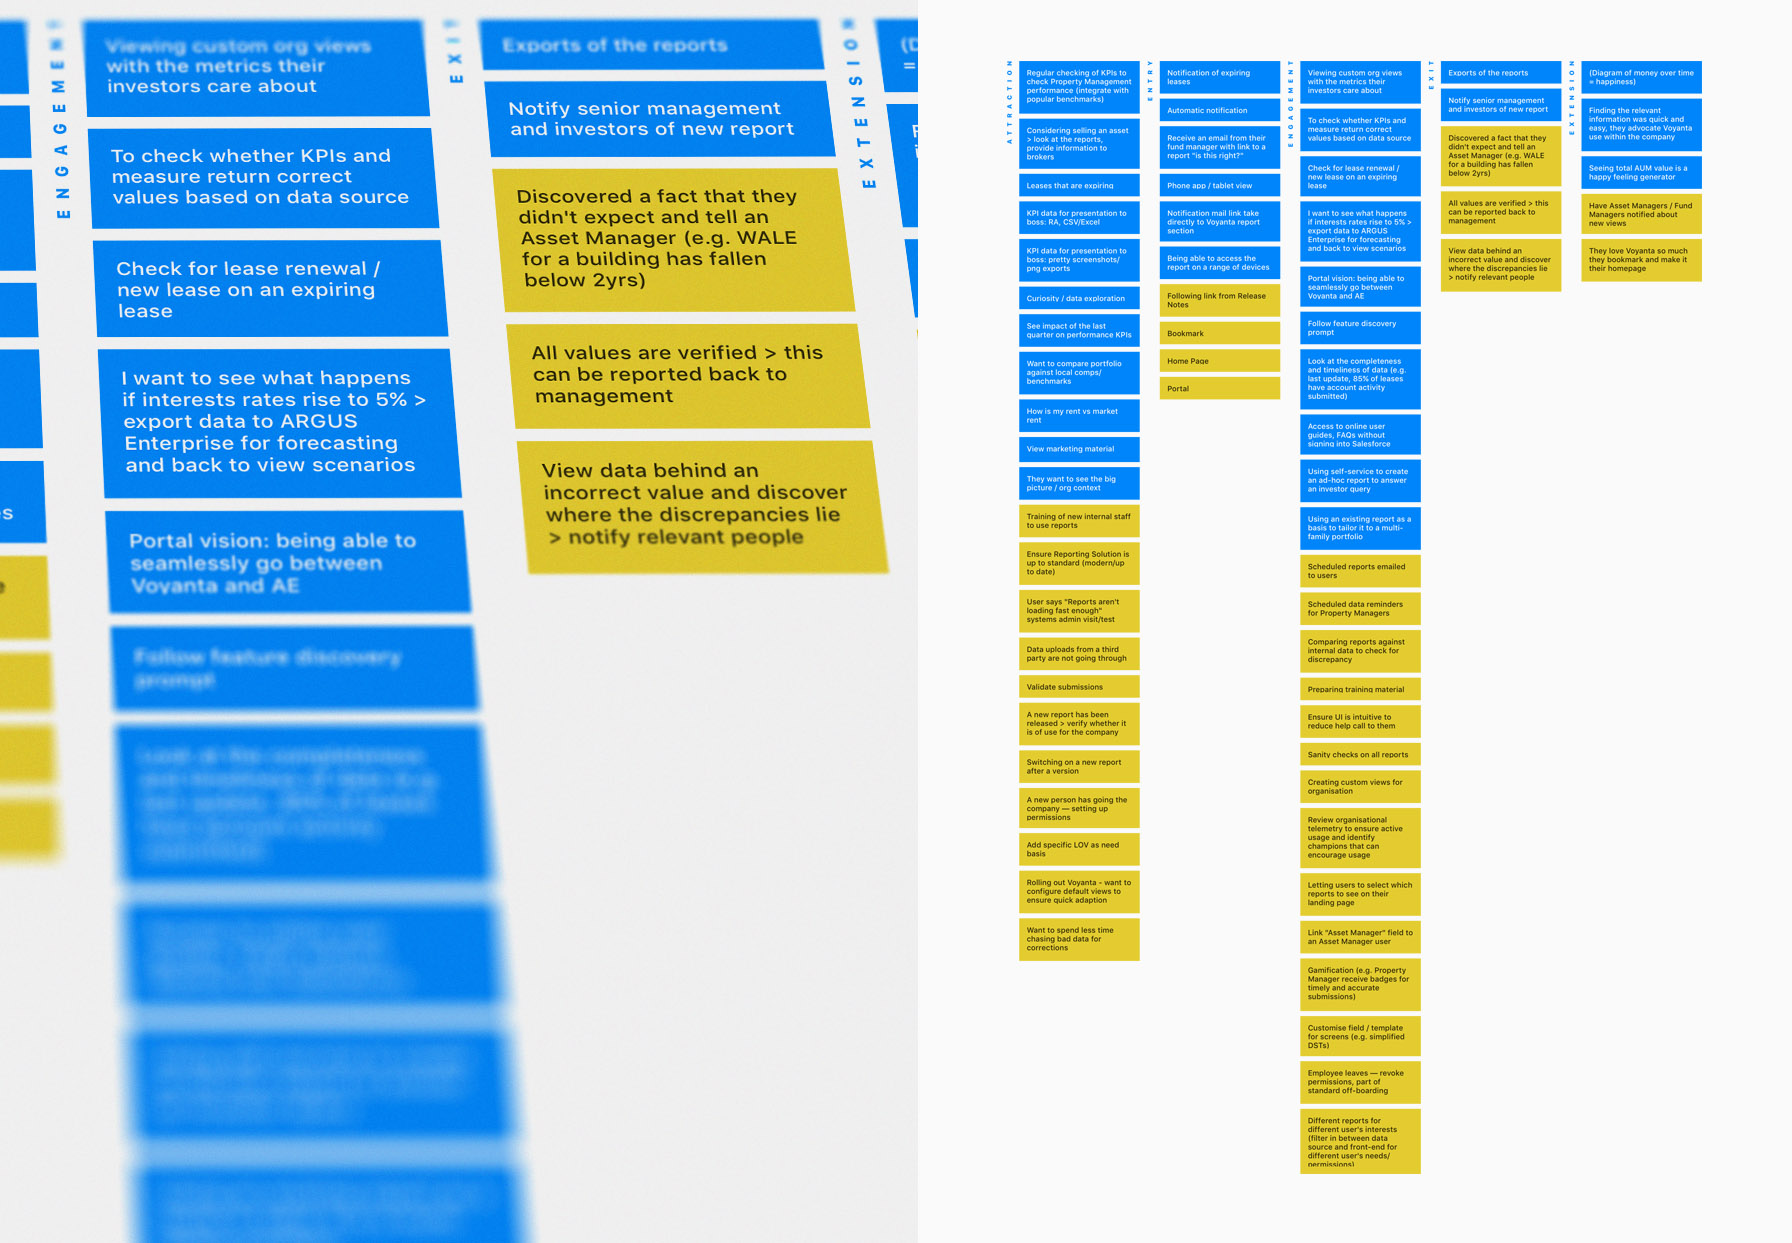
I started with consolidating all the existing feedback we’ve gathered from ARGUS Voyanta users. This identified common pain points and use cases across portfolio, leasing, and financial data analysis. Any gaps were filled by follow-up sessions with ARGUS Voyanta users and subject-matter experts. The followings themes emerged:
Proactive rather than reactive reporting
Which leases are expiring? What are the upcoming rent review dates? Is the market rent higher than the contract rent? Some of the most useful answers are the simplest. Asset Managers have to monitor a number of parties and data streams to ensure top financial performance on the properties they manage. A system that proactively informs Asset Managers of simple routine queries alleviates much of the frictions of reviewing leasing data.
From big picture to minute details
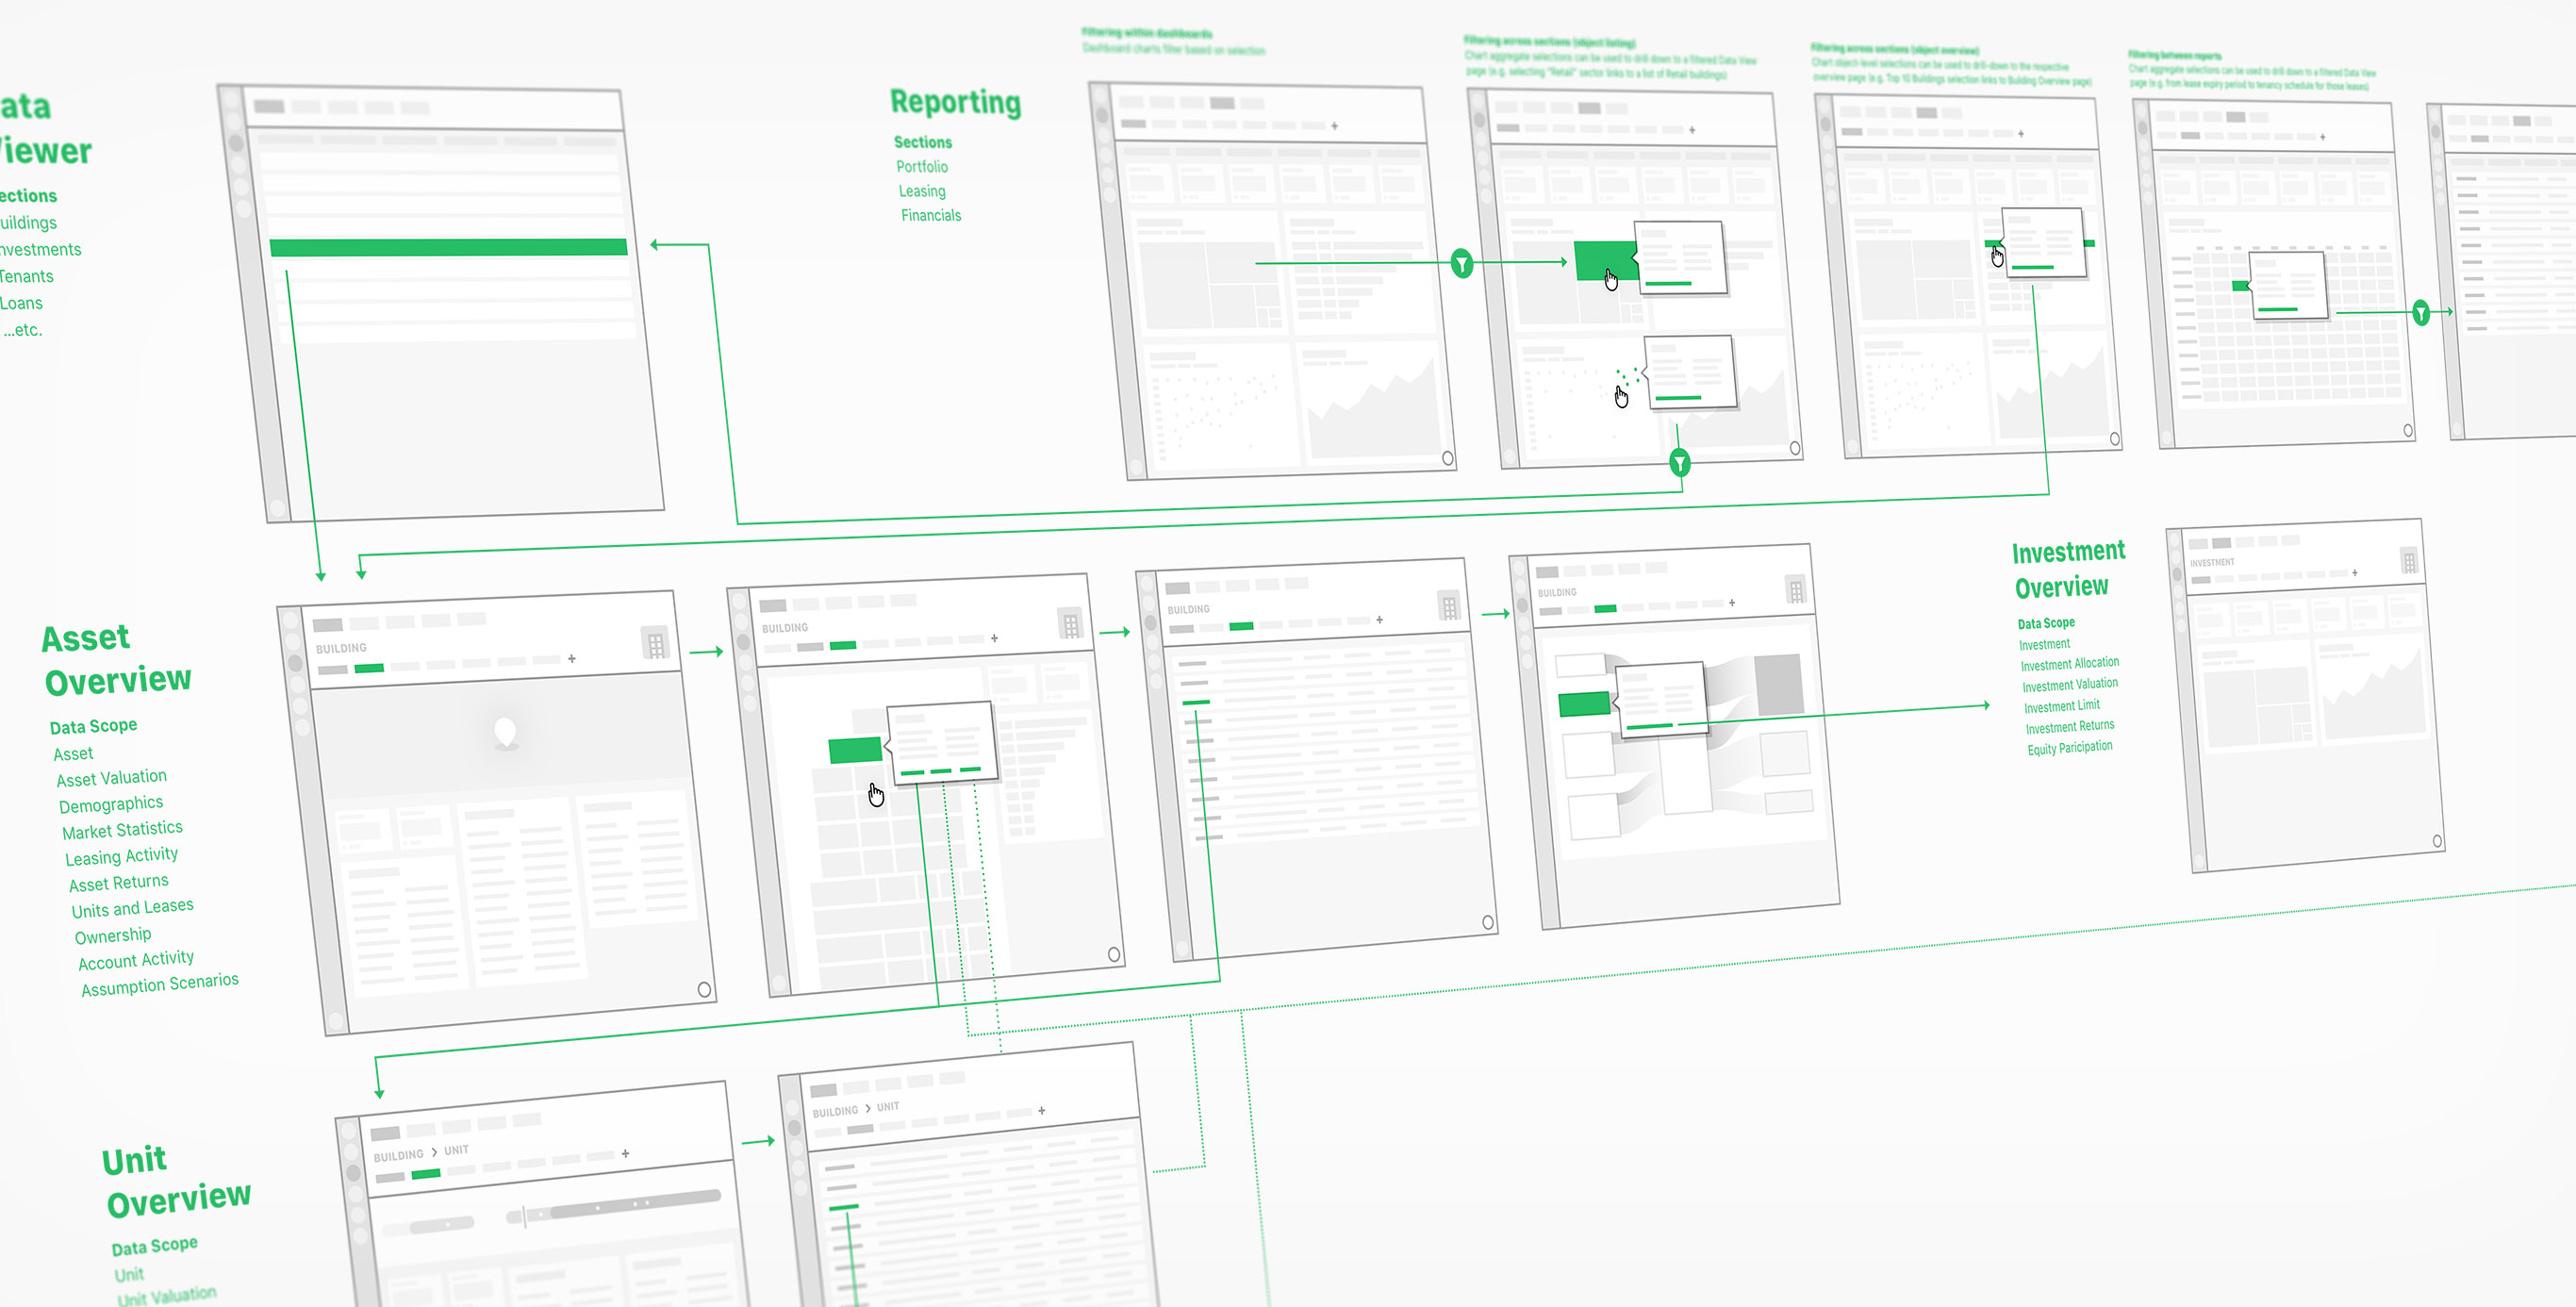
Using the same data, a user can take multiple perspectives — from evaluating a fund's performance to identifying an at-risk tenant. A user might start at portfolio diversification overview, identify an underperforming sector, then drill down to a particular building and lease. Reports need to be flexible to facilitate smooth exploration between various data granularities.
Transparency builds trust
With new reporting technologies sometimes it just takes one piece of misleading data for an organization to lose trust in an entire tool. When distrust is created, analysts would turn back to spreadsheets — compounding the problem. Transparency in data calculation builds user confidence in reports and ensures accurate interpretation.
With this background information, we were able to brainstorm compelling user flows, functionality, and reports. We looped in the development team early in the process to evaluate visualisation technologies and design for performance. One of the biggest technical and design challenges was ensuring the desired reports and interactions were also perceived as performant by end users. We worked together to iteratively refine the report design and provide sufficient feedback for reports to load in a timely manner.
I prototyped new visualisation methods using D3.js and Tableau. With the prototypes, I was able to conduct usability testing, gather client feedback, and test visualisations with real data before they’re taken into production. This process helped us prioritize feature releases, resolve usability issues, and ensure report usefulness.
Key Screens
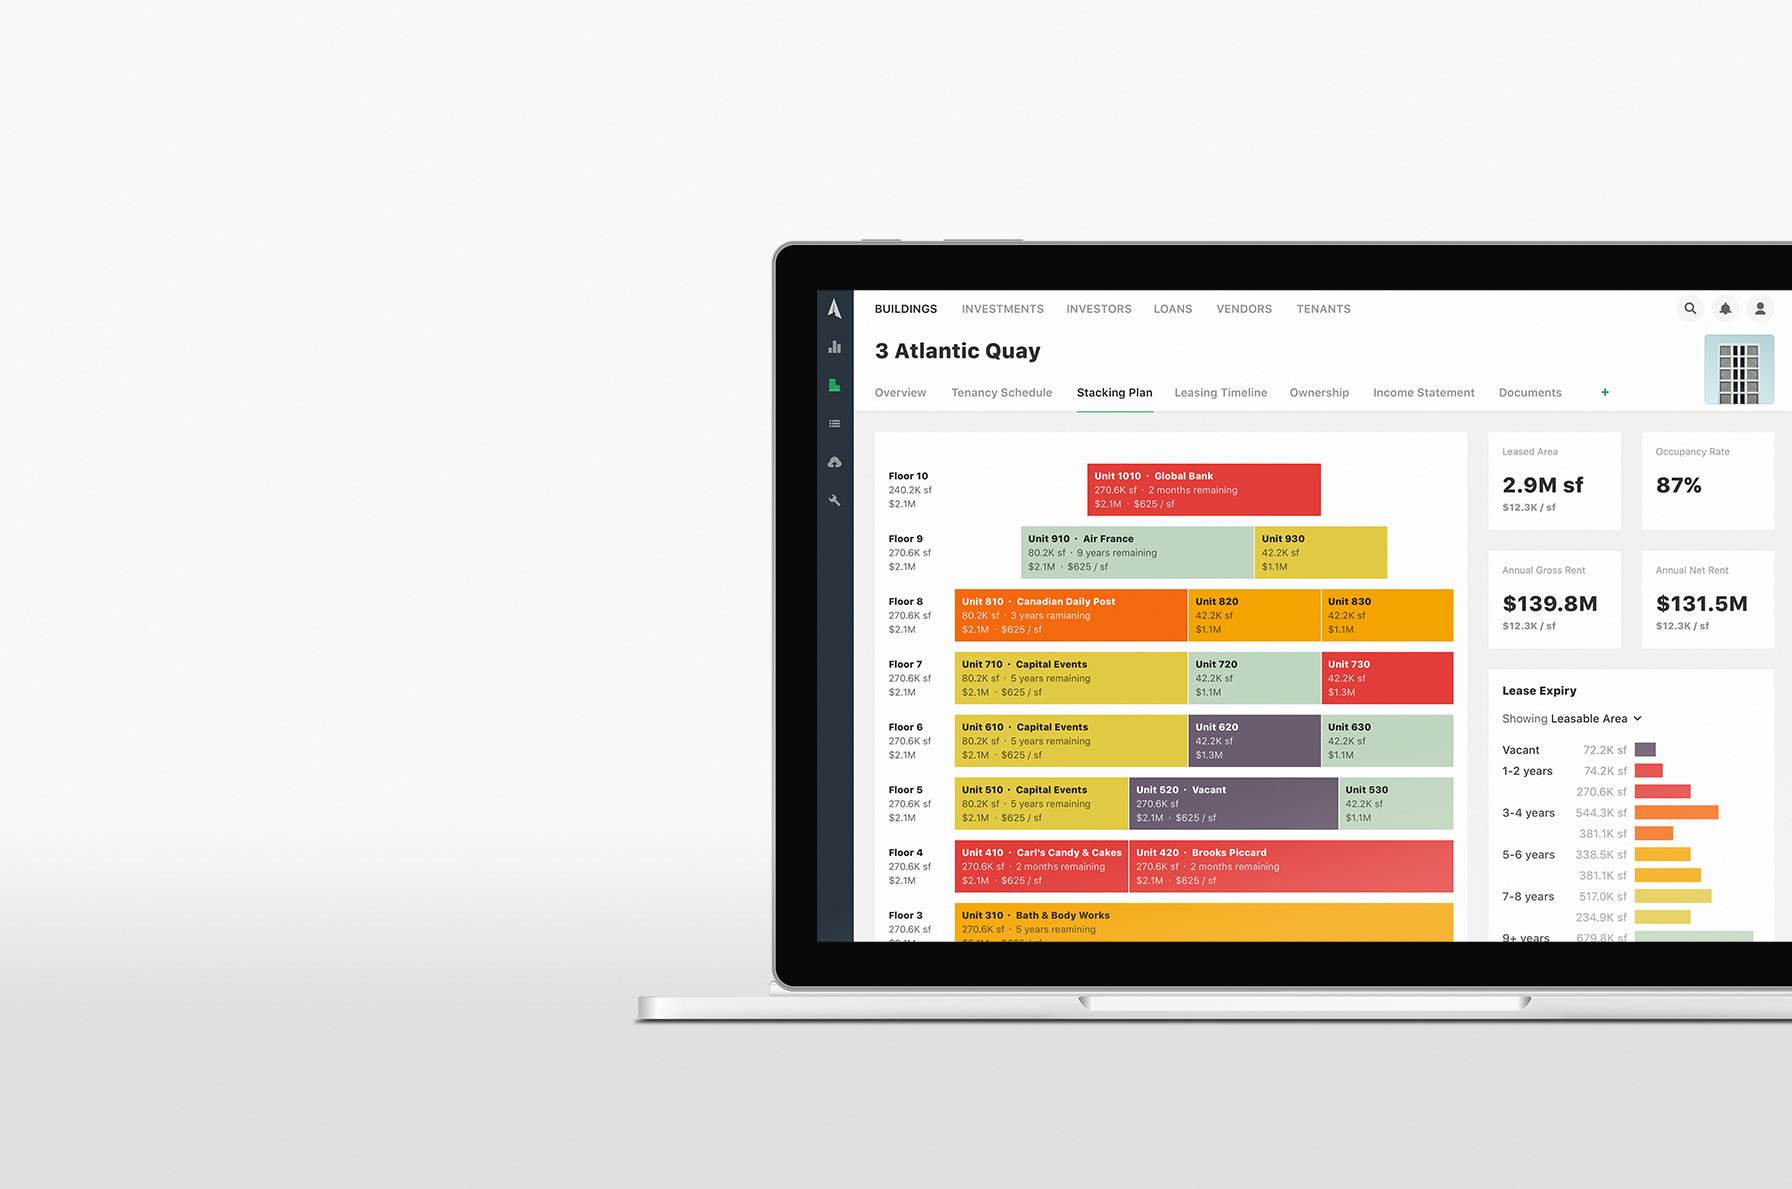
ARGUS Voyanta Reports is a way for Asset Managers and Portfolio Managers to explore, analyse, and report on their real estate portfolio. The reports are designed to allow a user to easily navigate between data perspectives and resolutions — an Asset Manager might discover a building with a low occupancy rate at the portfolio level and drill-down to the unit level to address a leasing issue. Below are a few select screens I’ve designed:
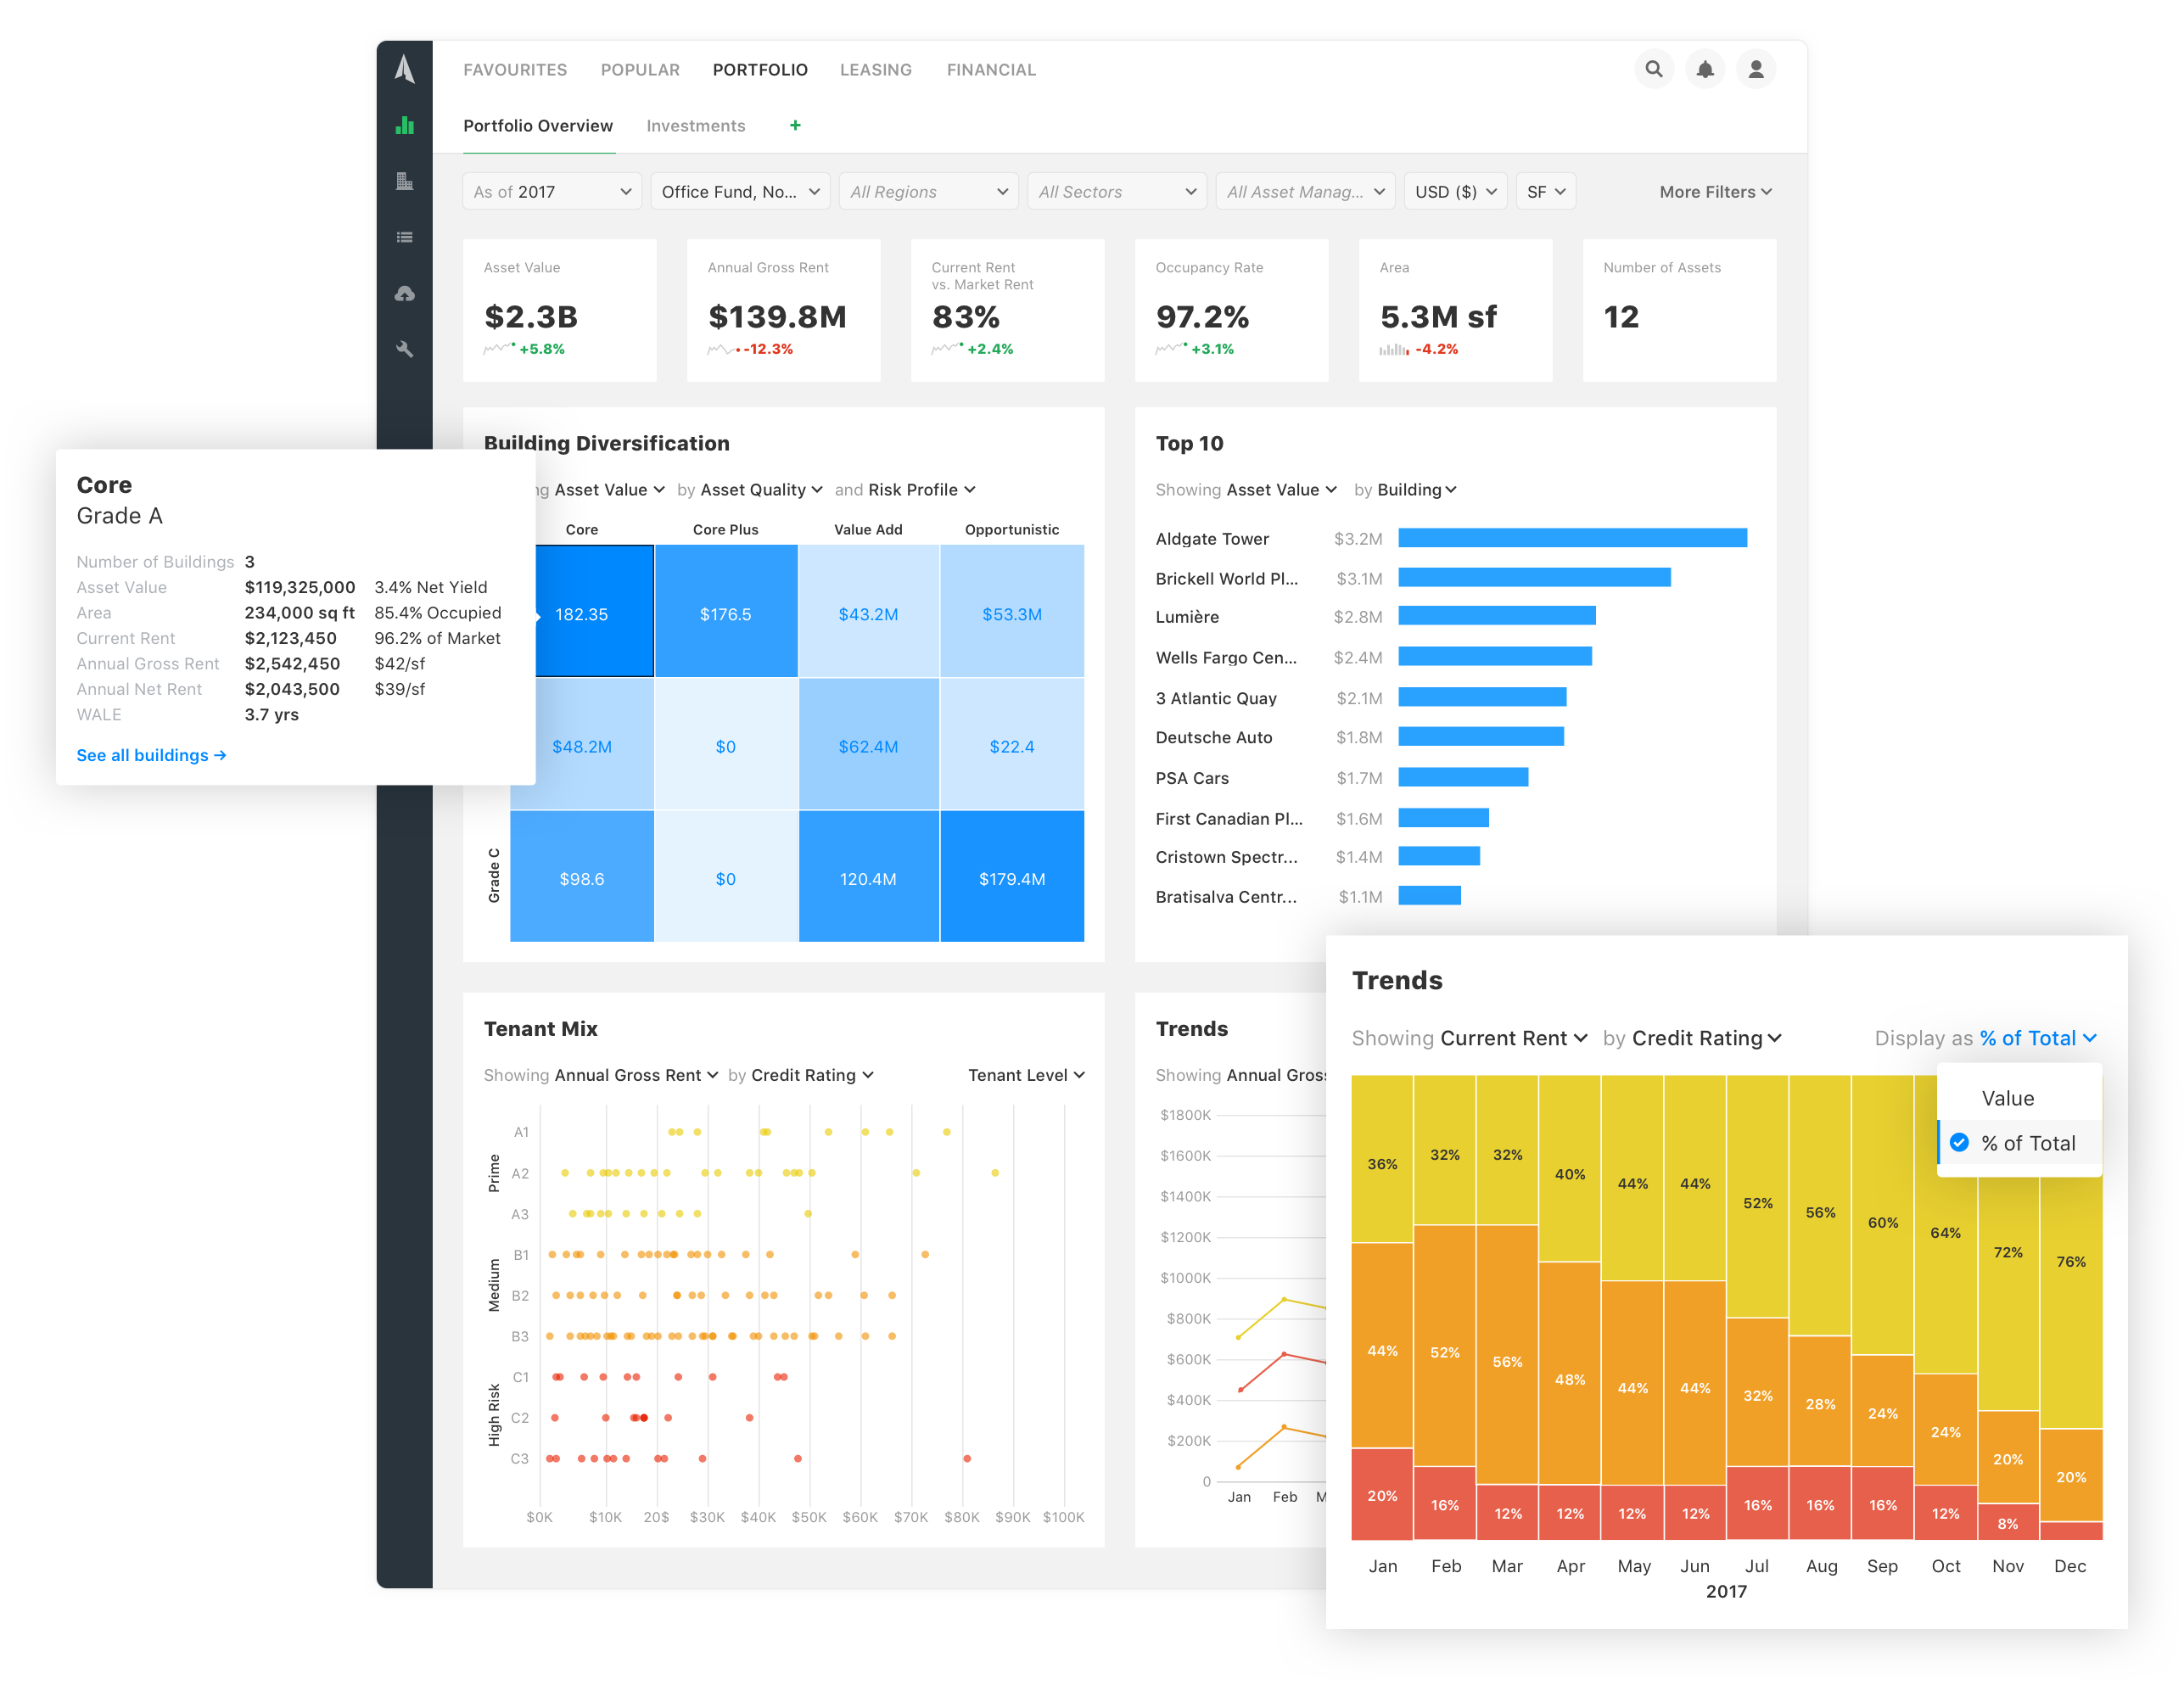
Portfolio Overview: A high-level overview of a portfolio of buildings for Asset and Portfolio Managers to track building performance against the business plan. Dashboards are designed to allow users to interrogate their data from multiple perspectives — from investor queries to diversification goals. Key performance indicators are summarised up top to provide context to dashboard content.
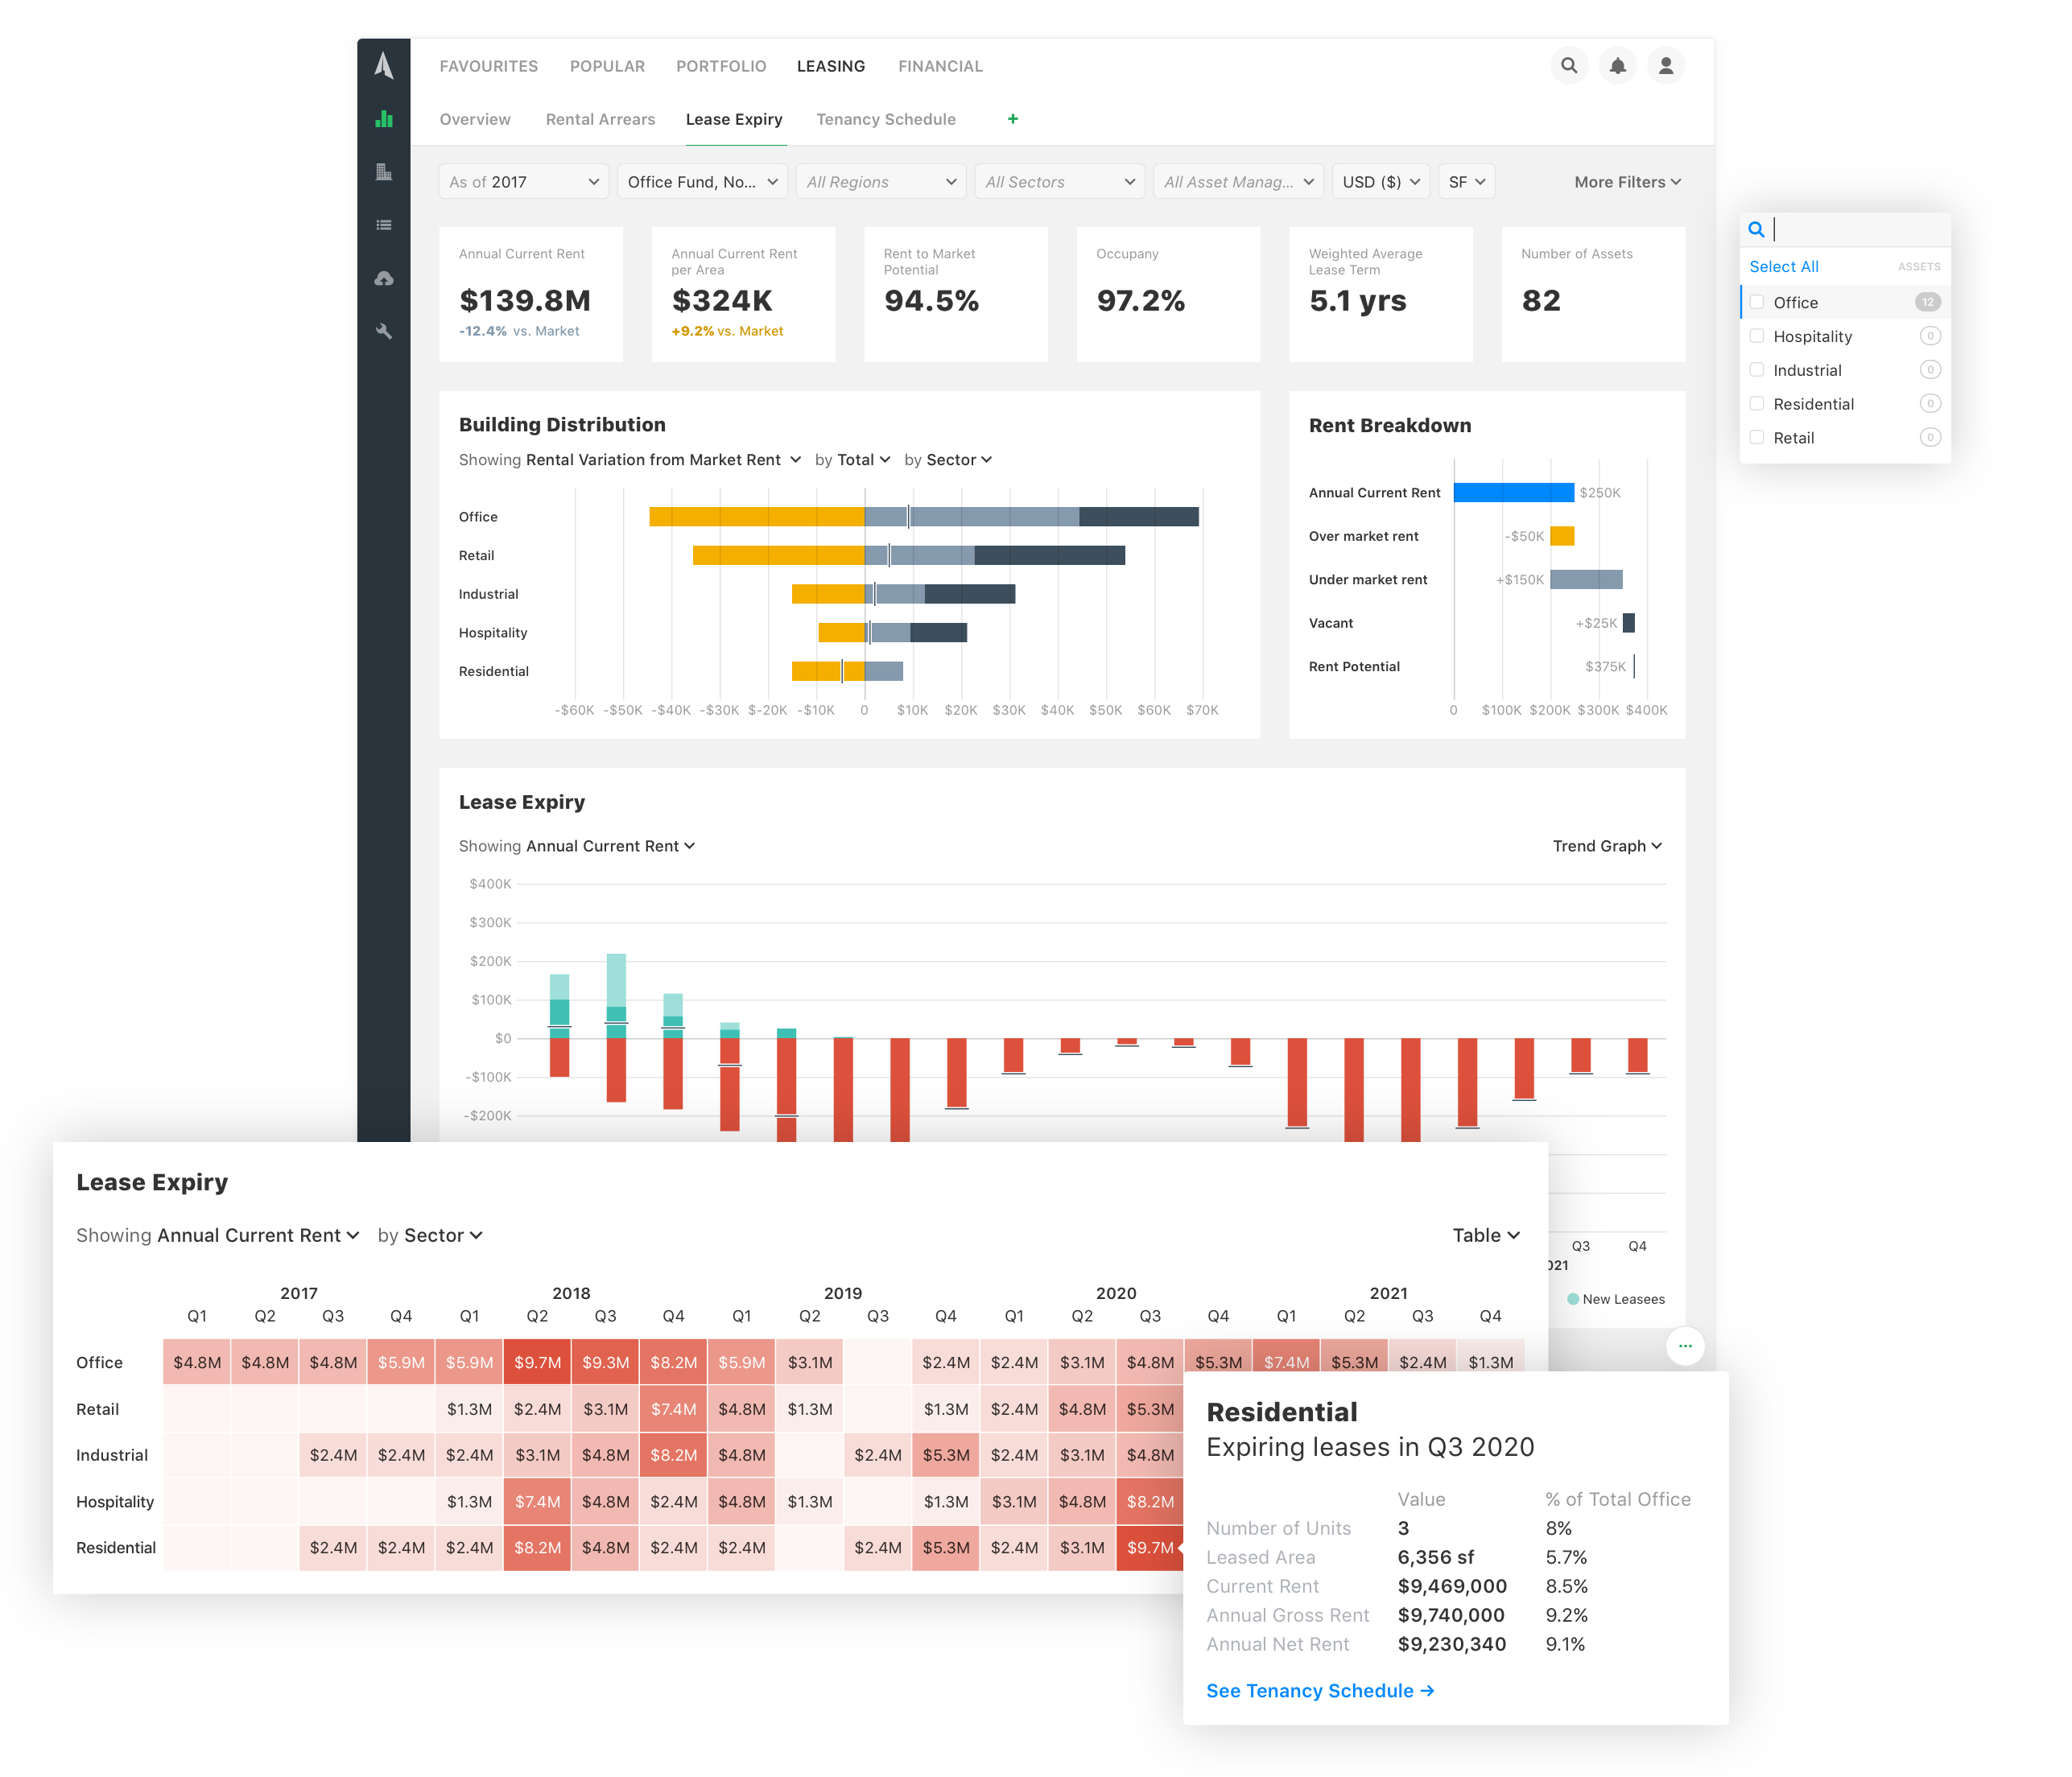
Lease Expiry: Real estate as an asset class requires very active monitoring. The Lease Expiry dashboard is designed for Asset Managers to identify risks and opportunities associated with rental income of the building.
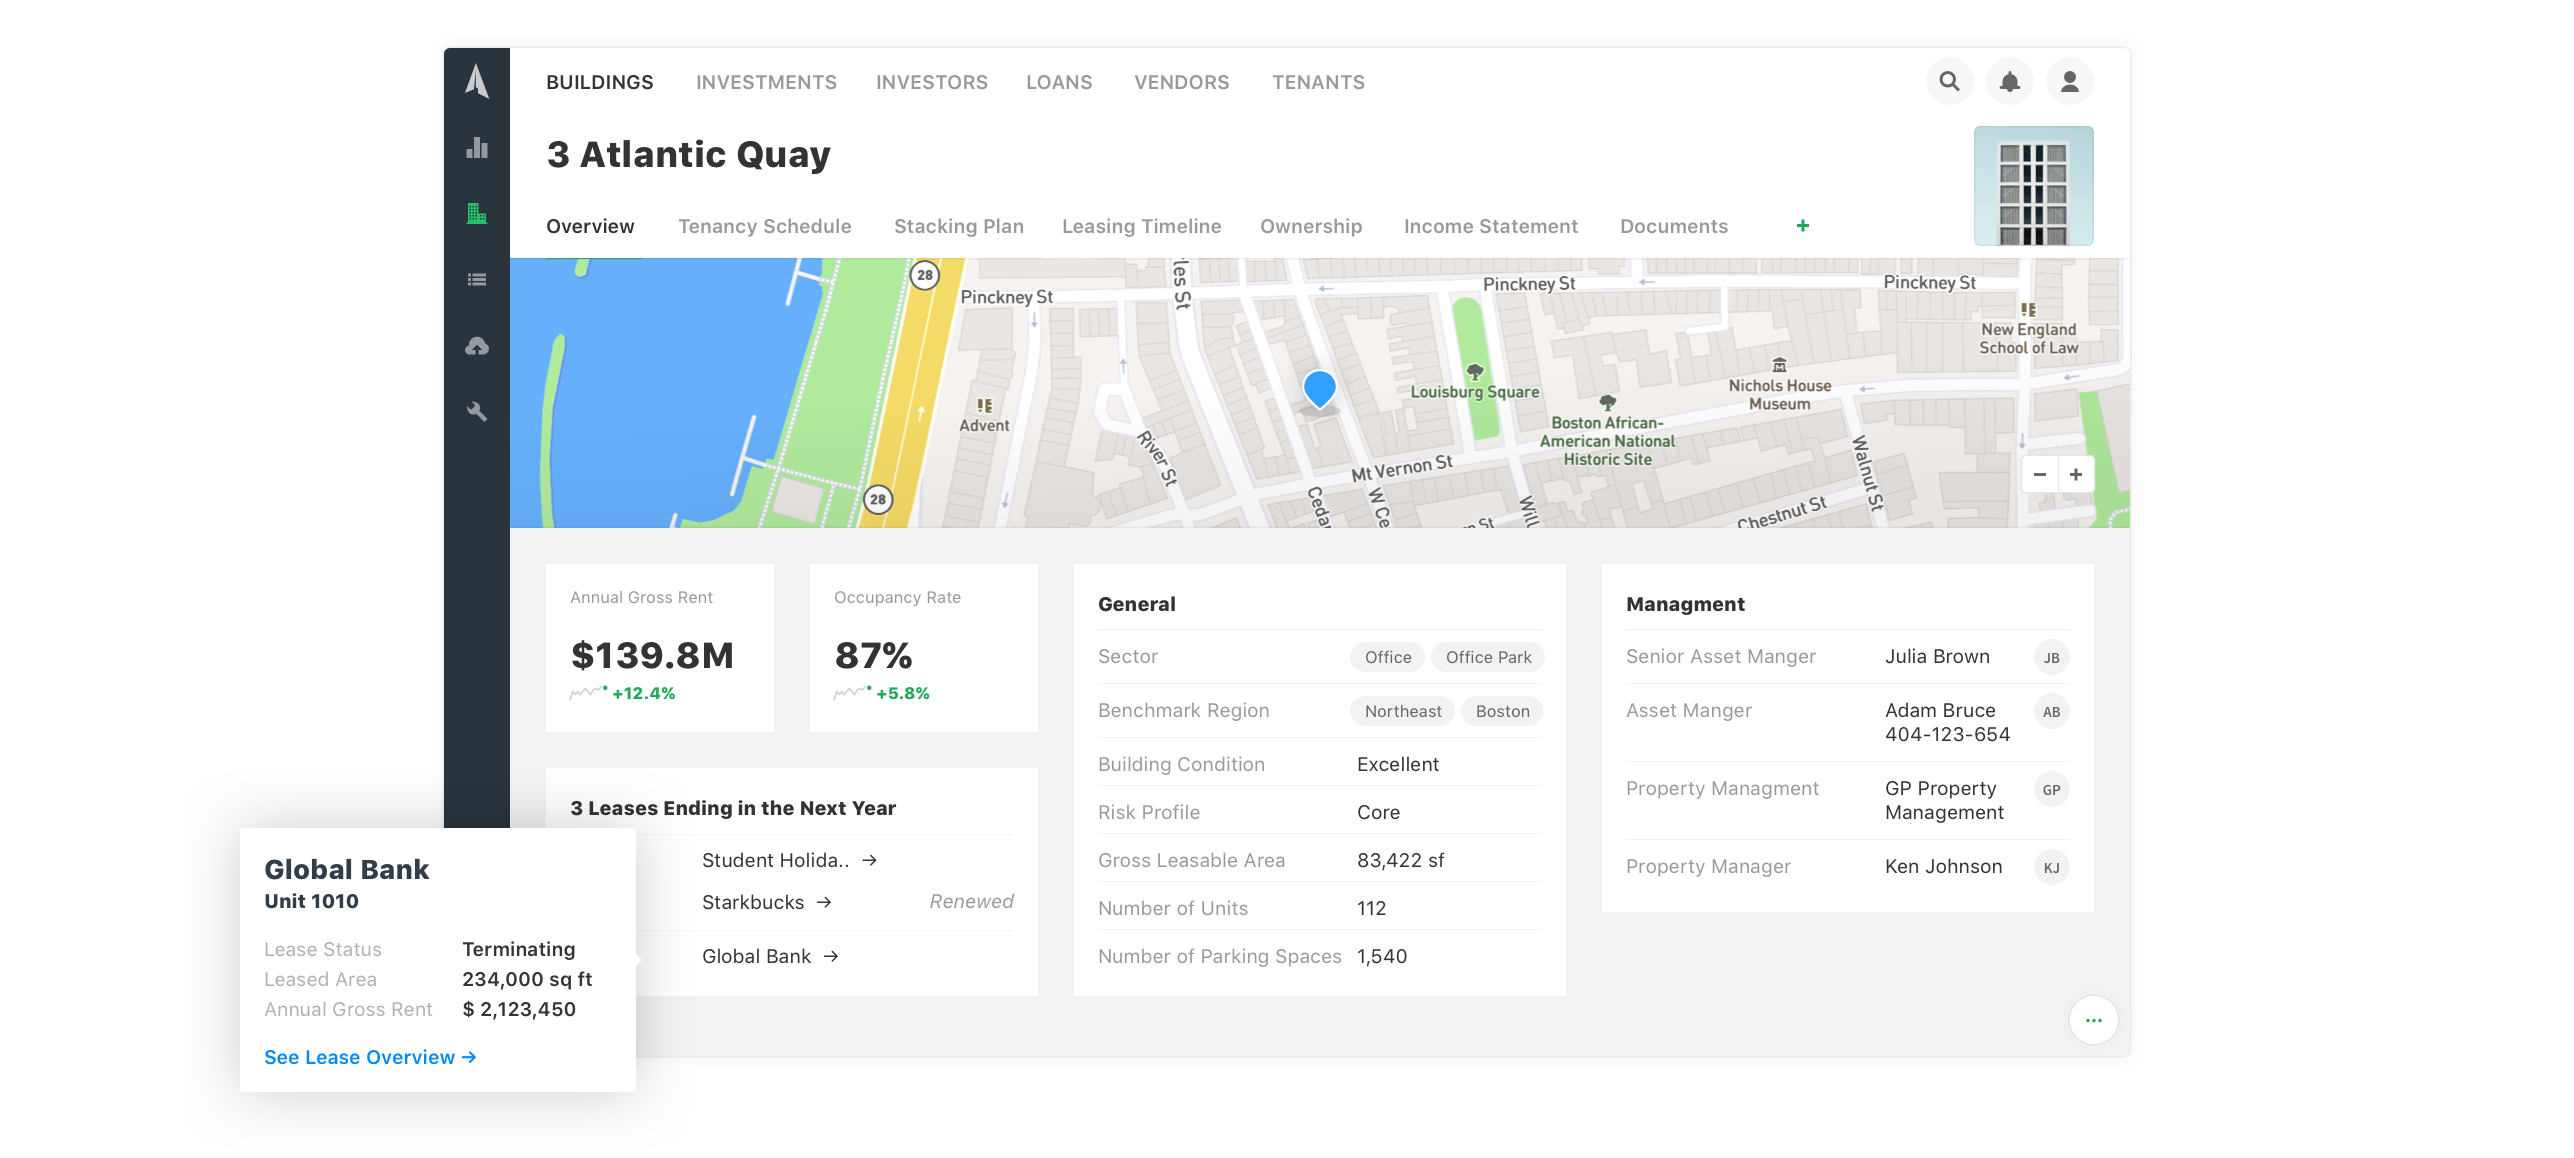
Building Overview: A curated set of dashboard exposing all the underlying data of a building from the perspective of Valuations, Leasing, Financials, and more.
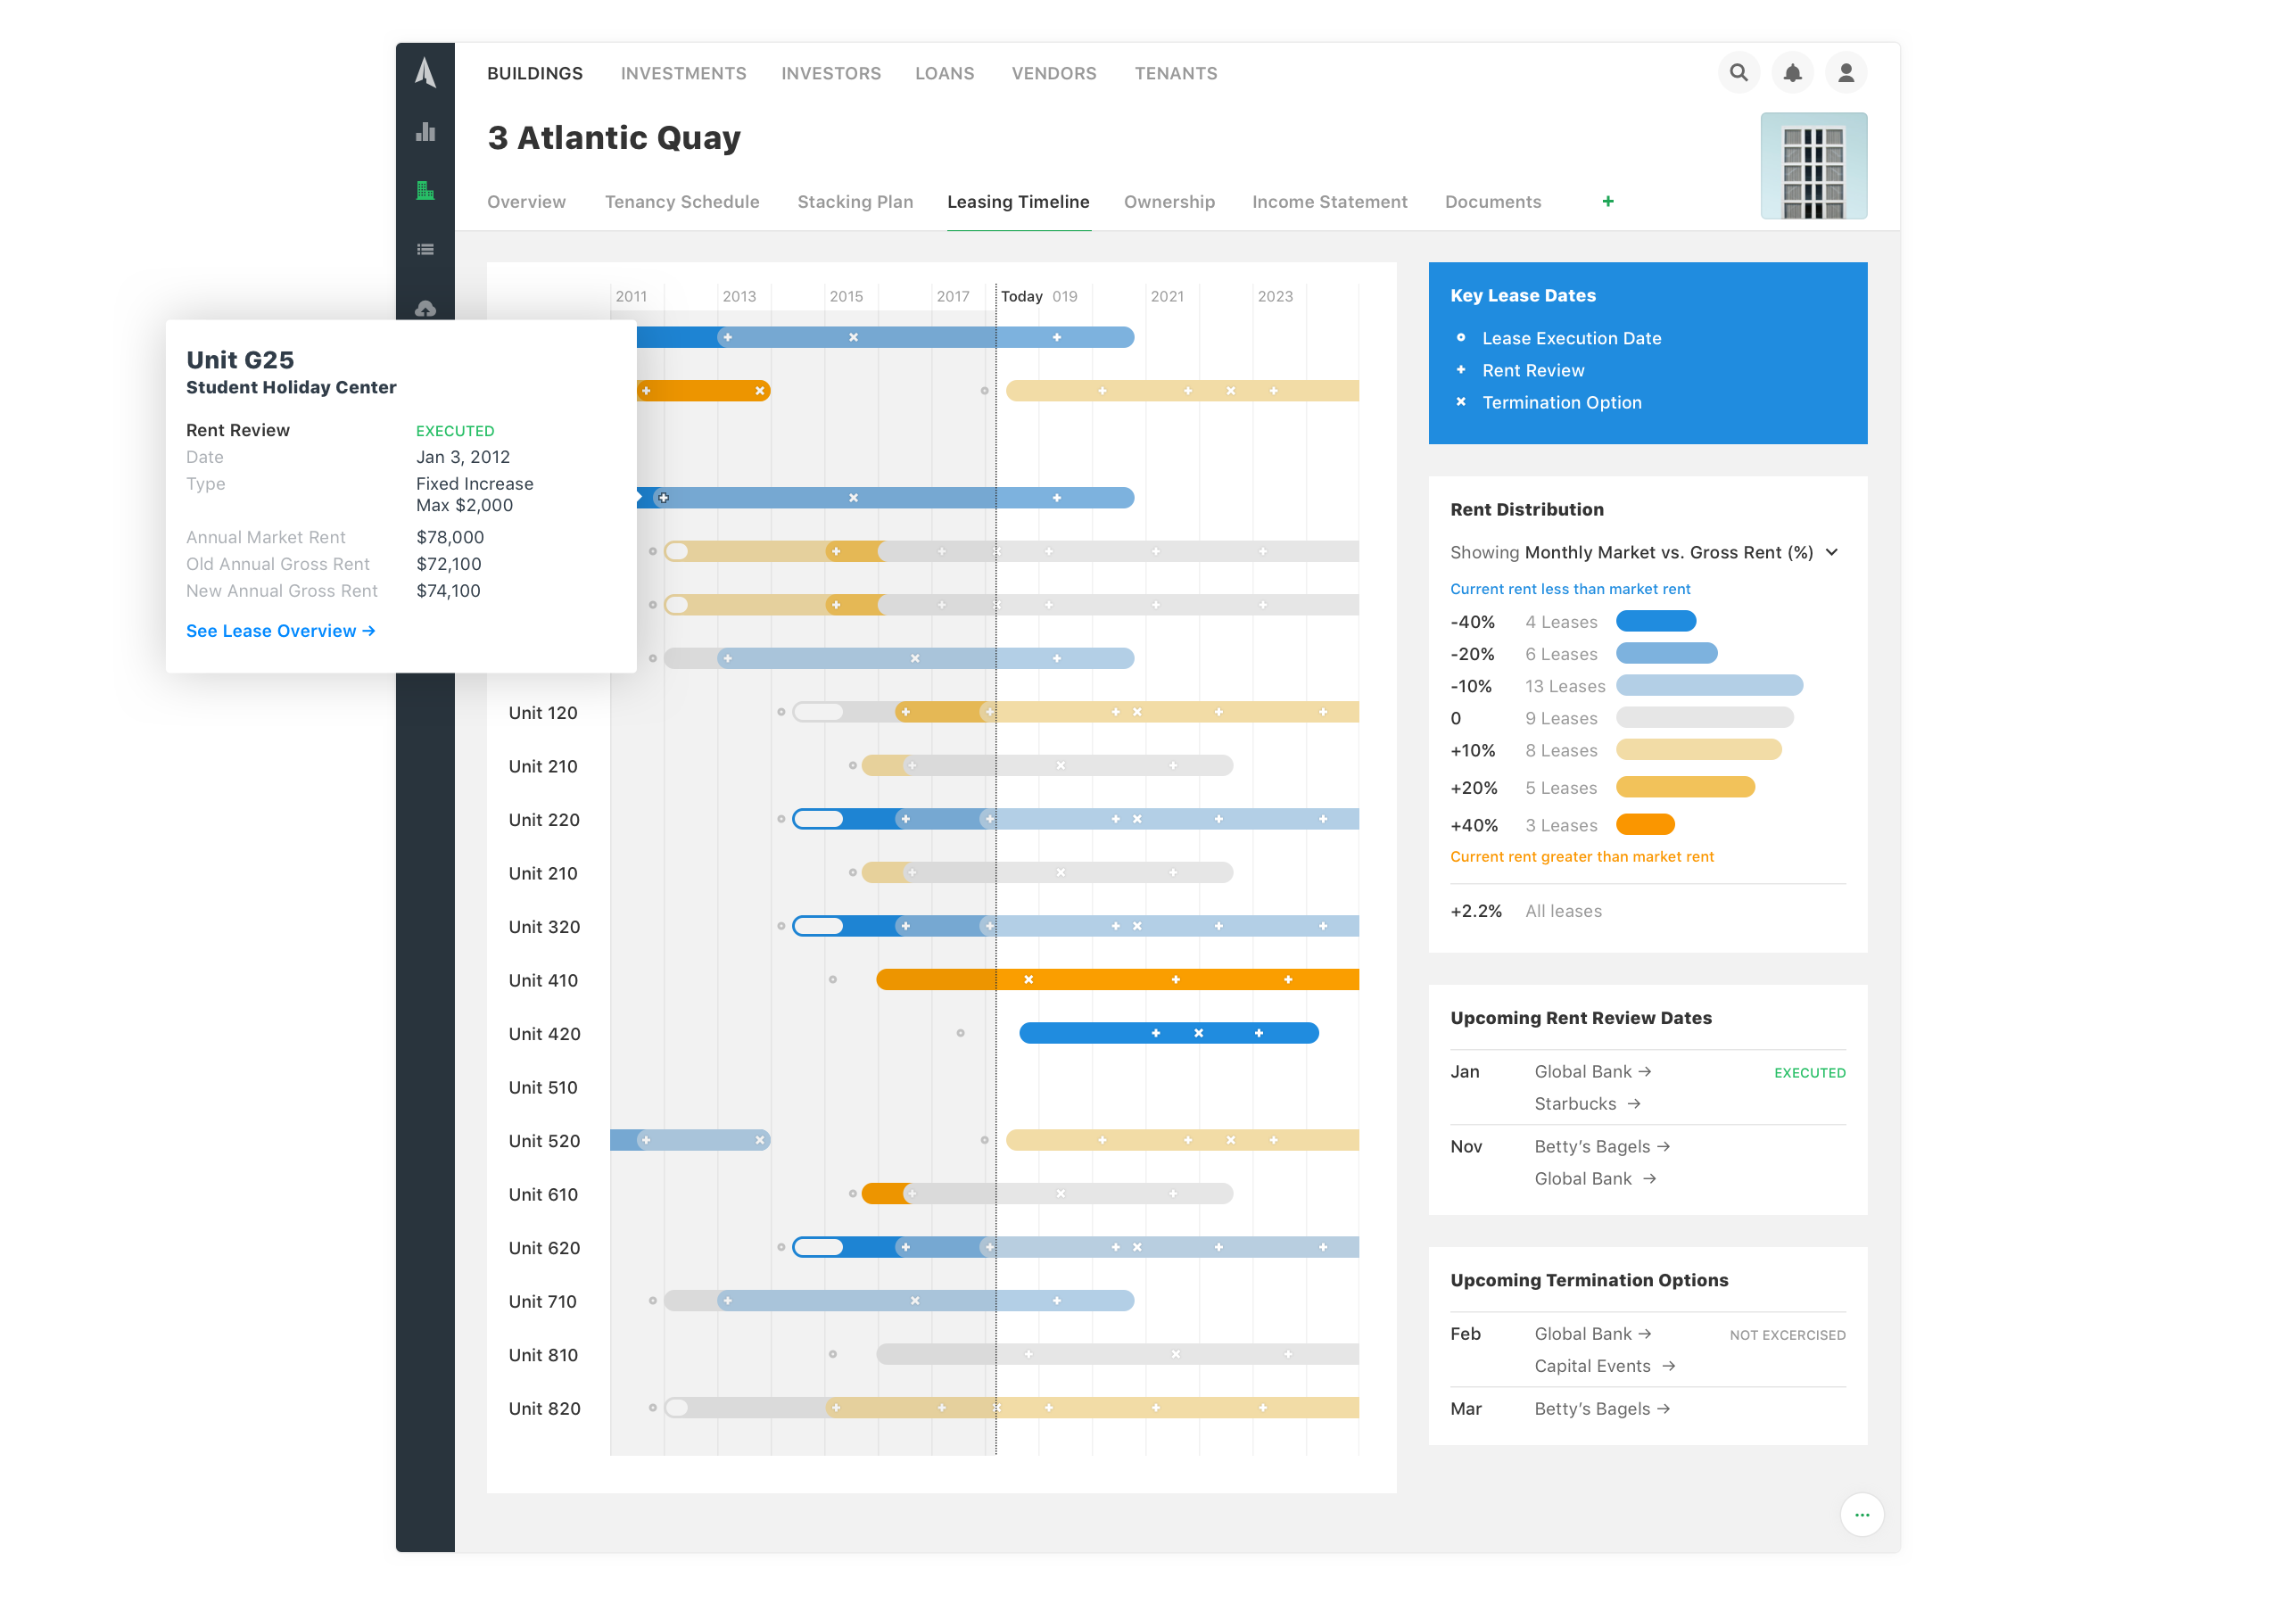
Leasing Timeline: A key piece of user feedback we received is that it’s cumbersome to keep track of all the upcoming rent review and termination options — causing Asset Managers to miss important lease dates. This dashboard visualises all upcoming lease dates in a timeline and highlights where action is required.
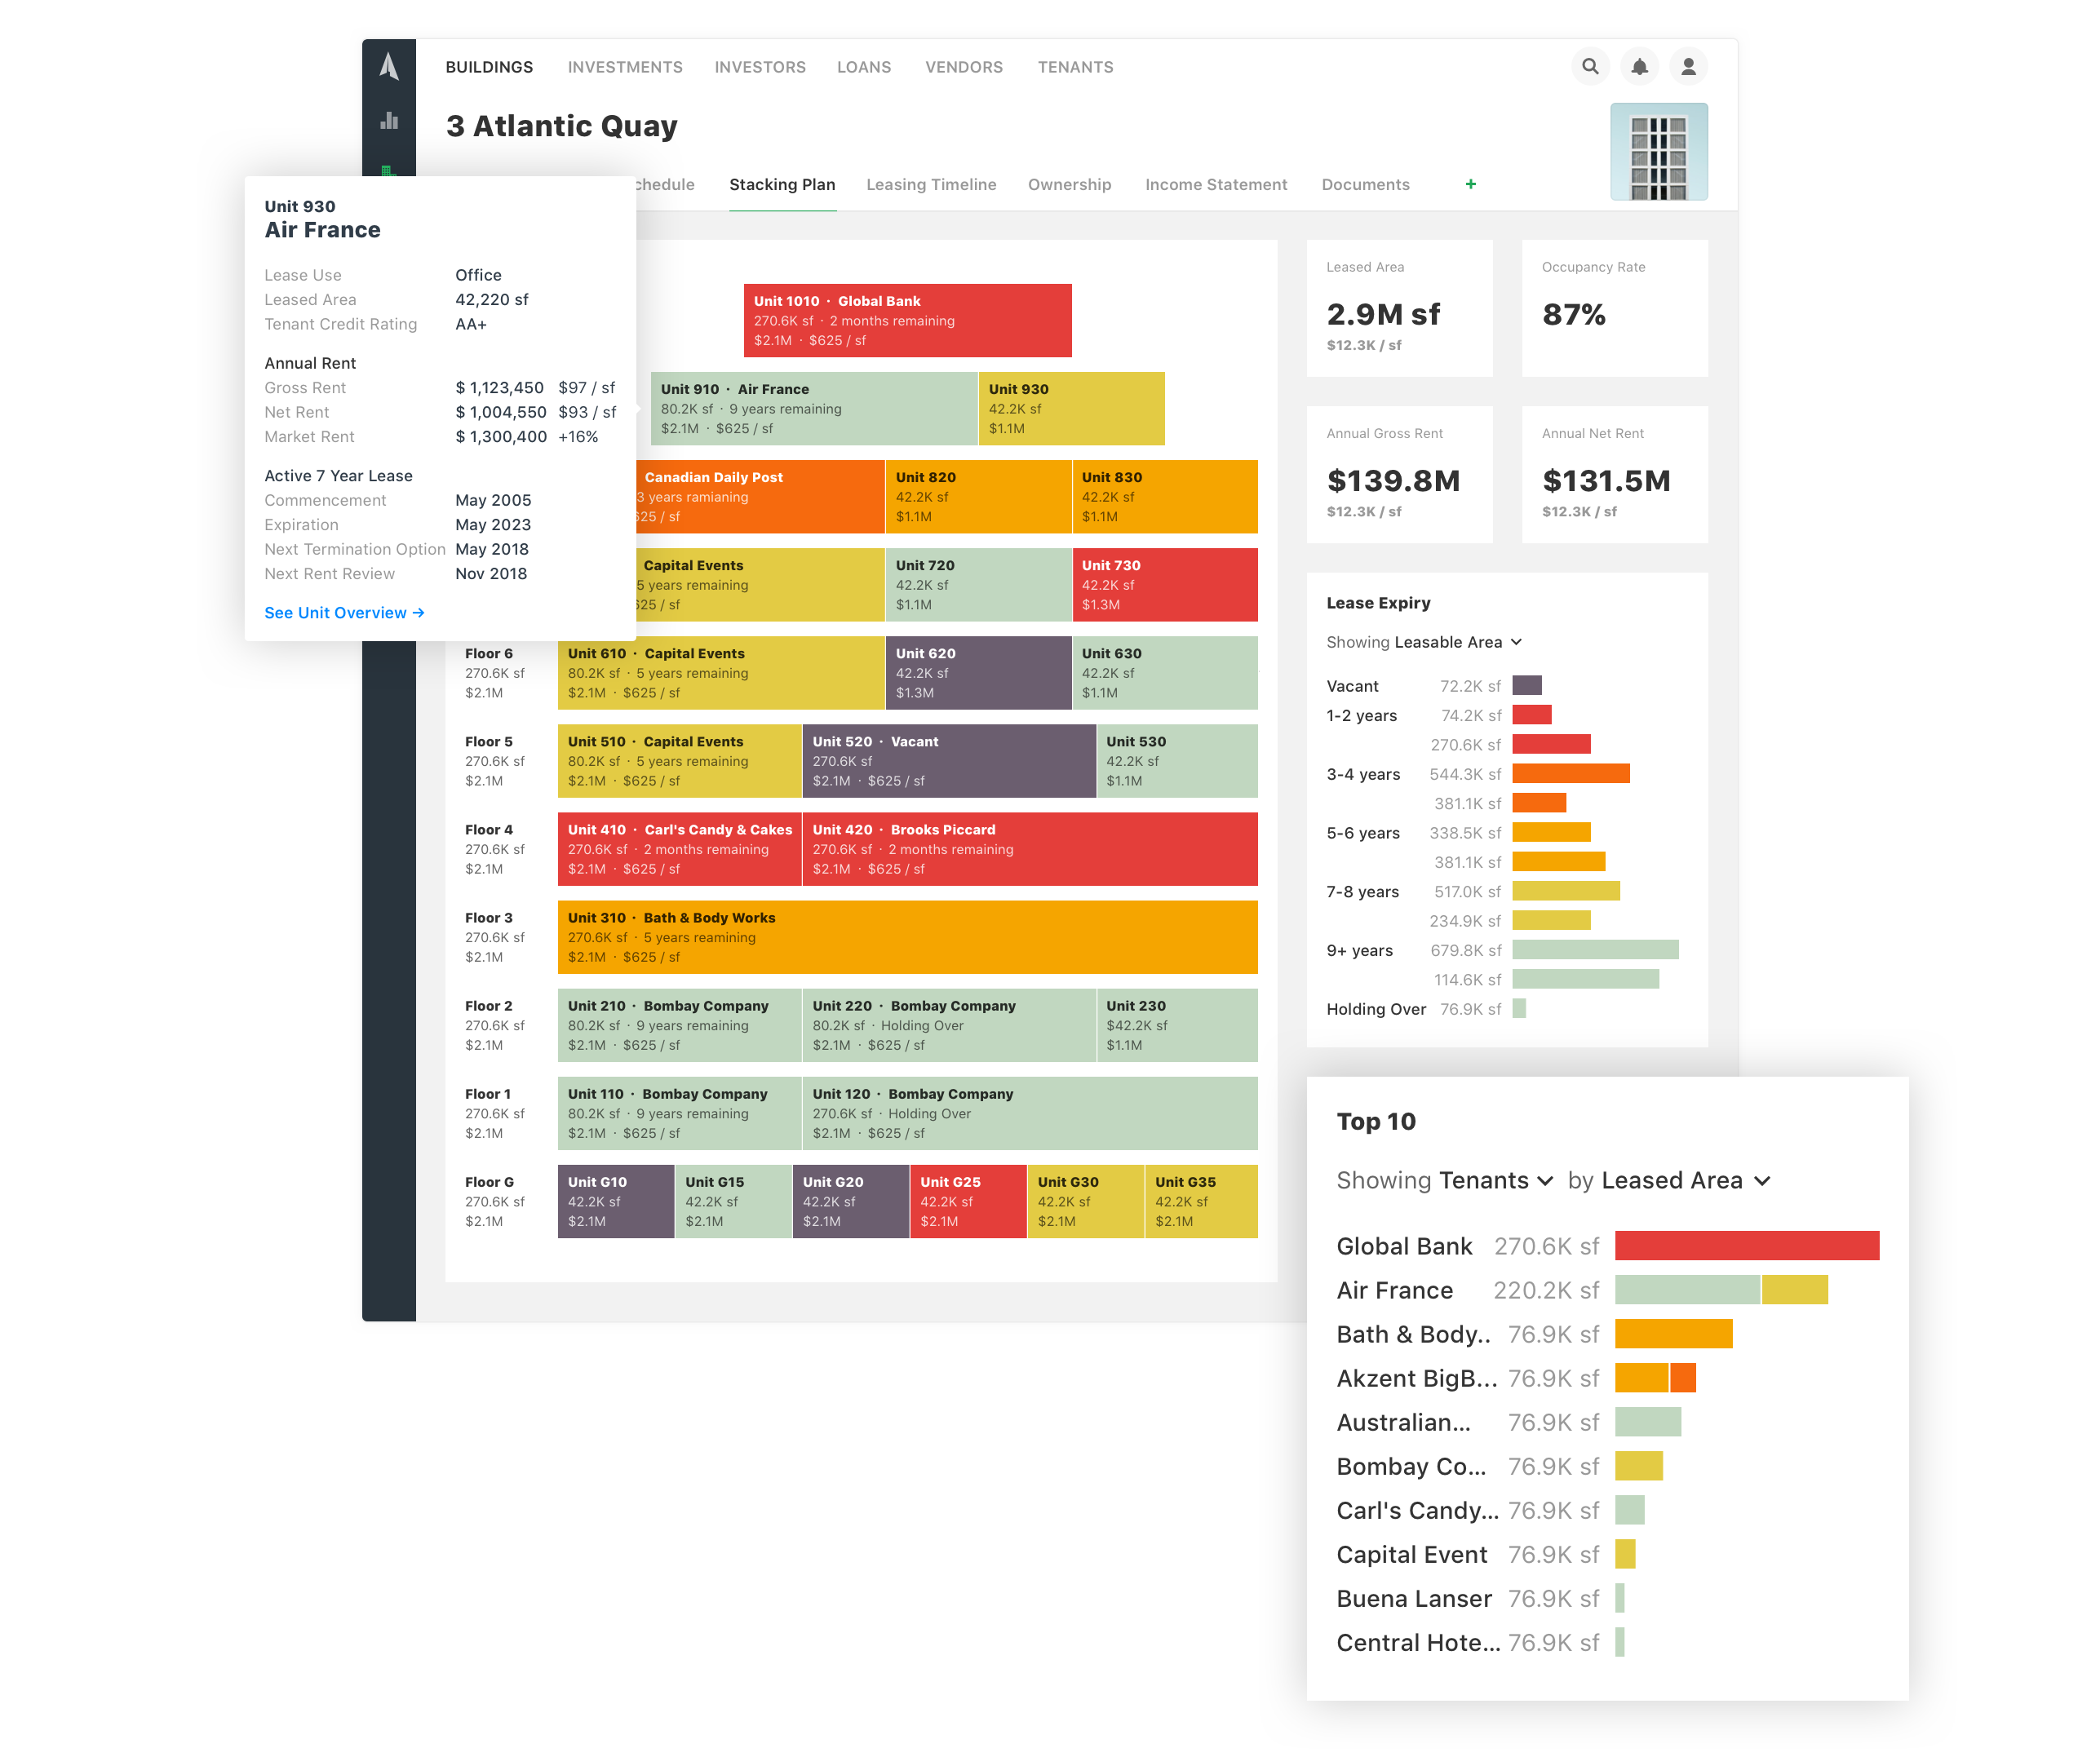
Stacking Plan: A floor-by-floor visual representation of building leasing activity. Units with expiring leases are in red — highlighting potential risks.
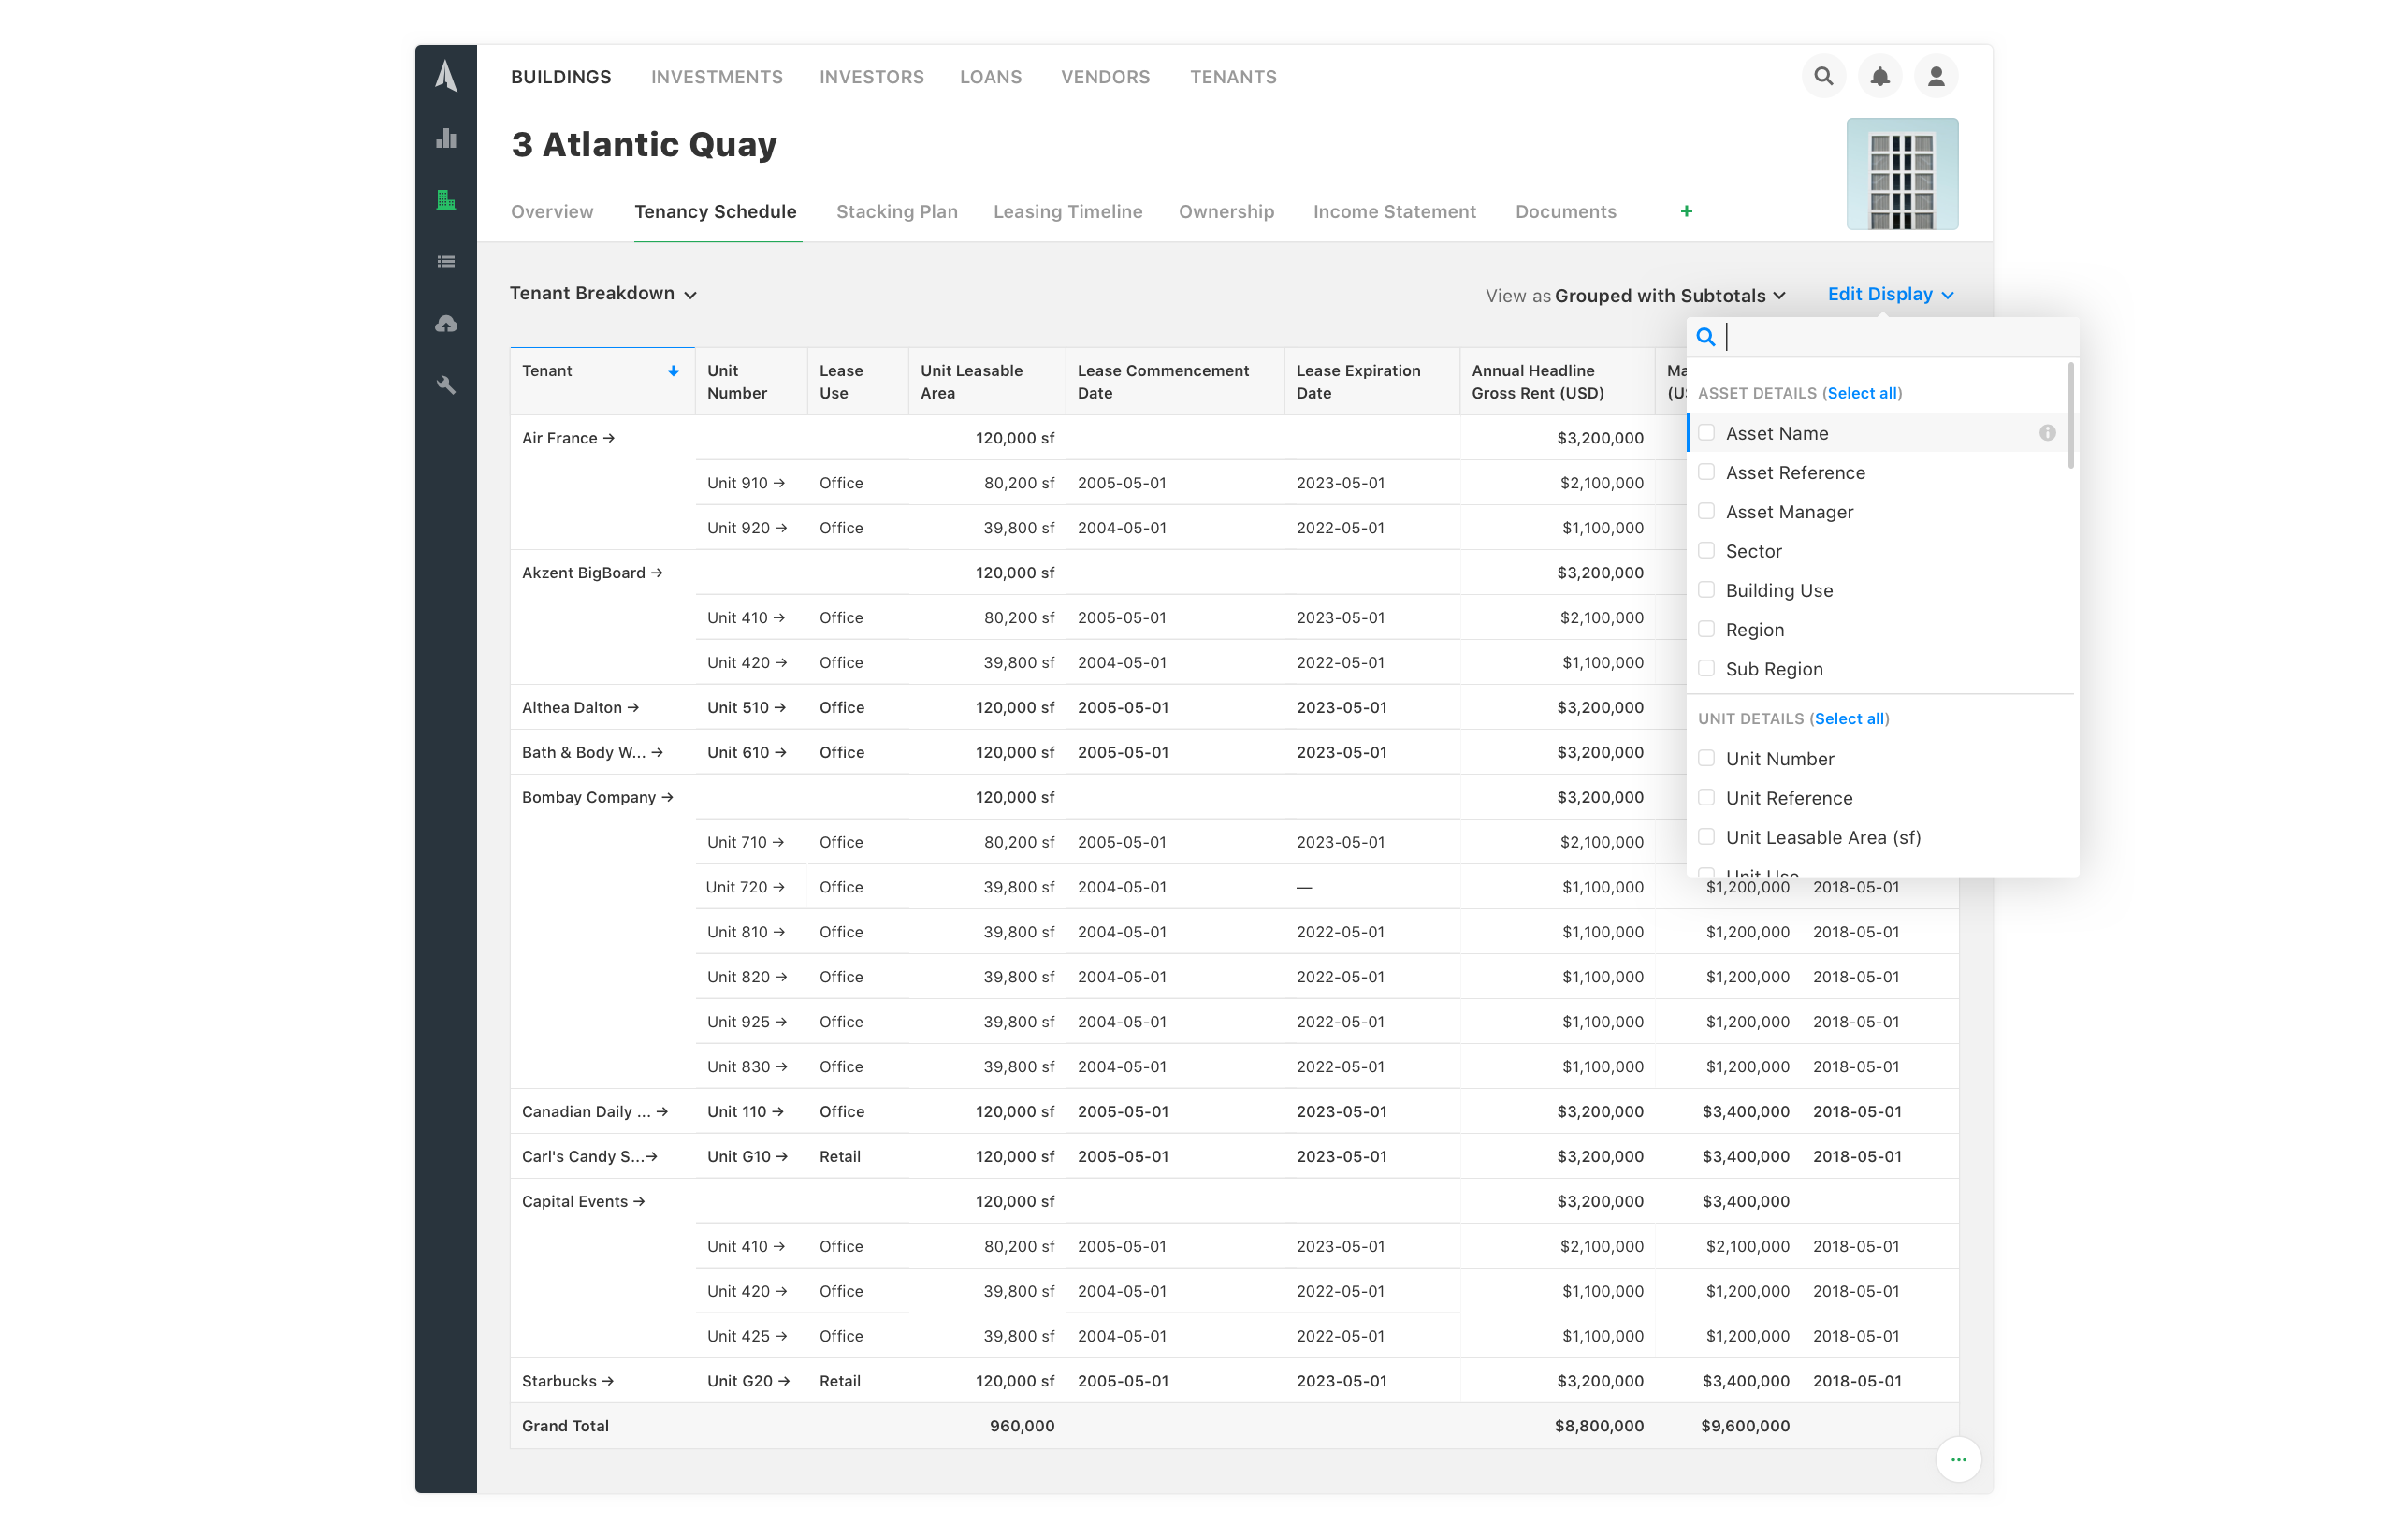
Tenancy Schedule: A tabular view of building leasing activity. Tabular report views are designed to be highly configurable — revealing all underlying data for ad-hoc queries.
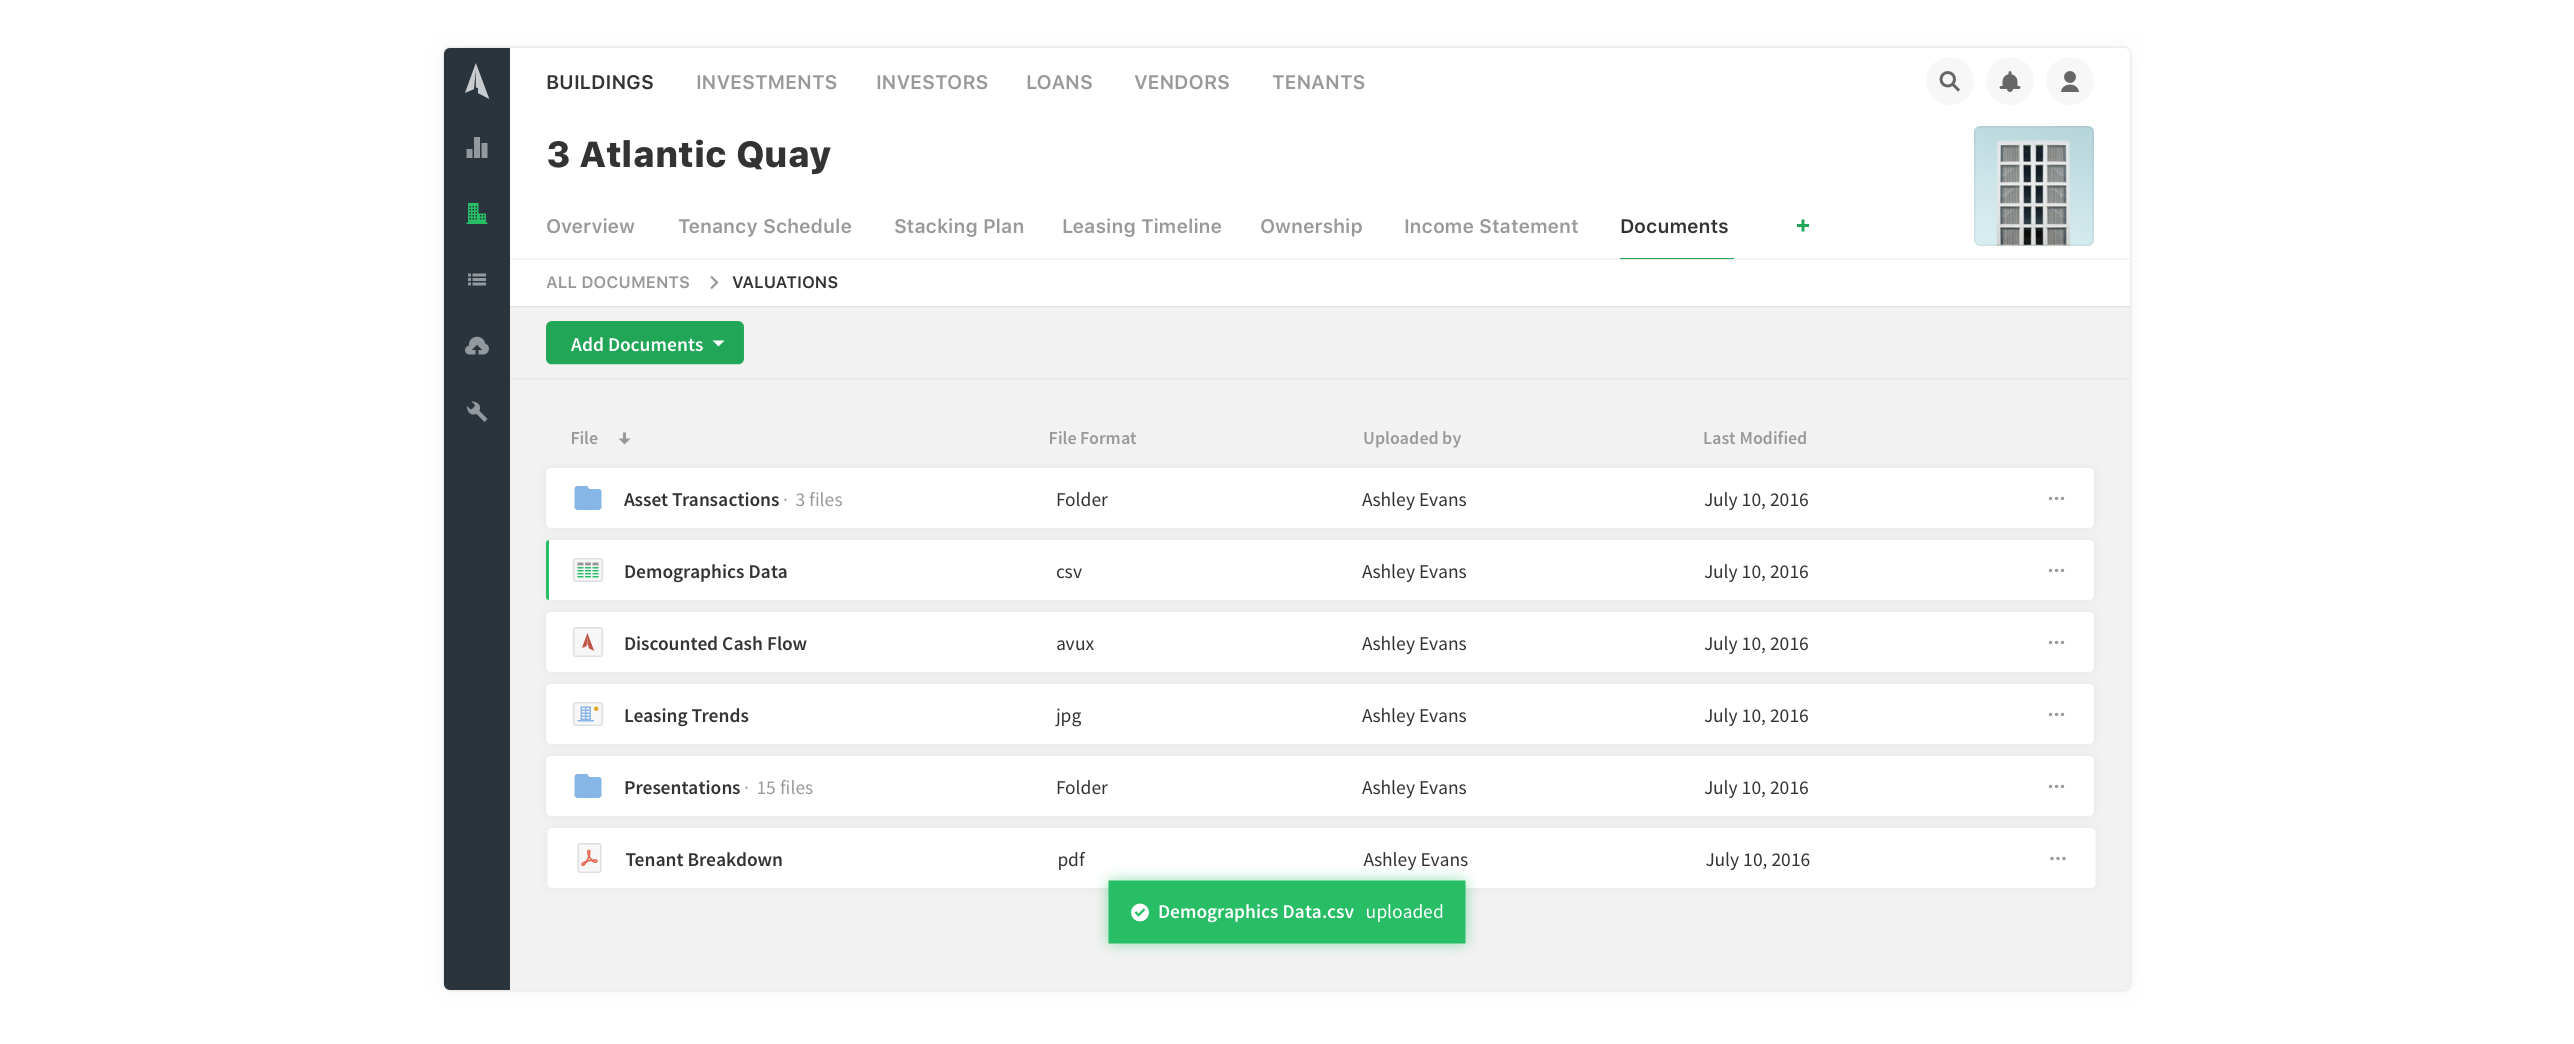
Documents: Users can store documents relevant to a building — such as loan agreements, floor plans, and more. Keeping building documents alongside building data is key to creating a centralised source of truth.
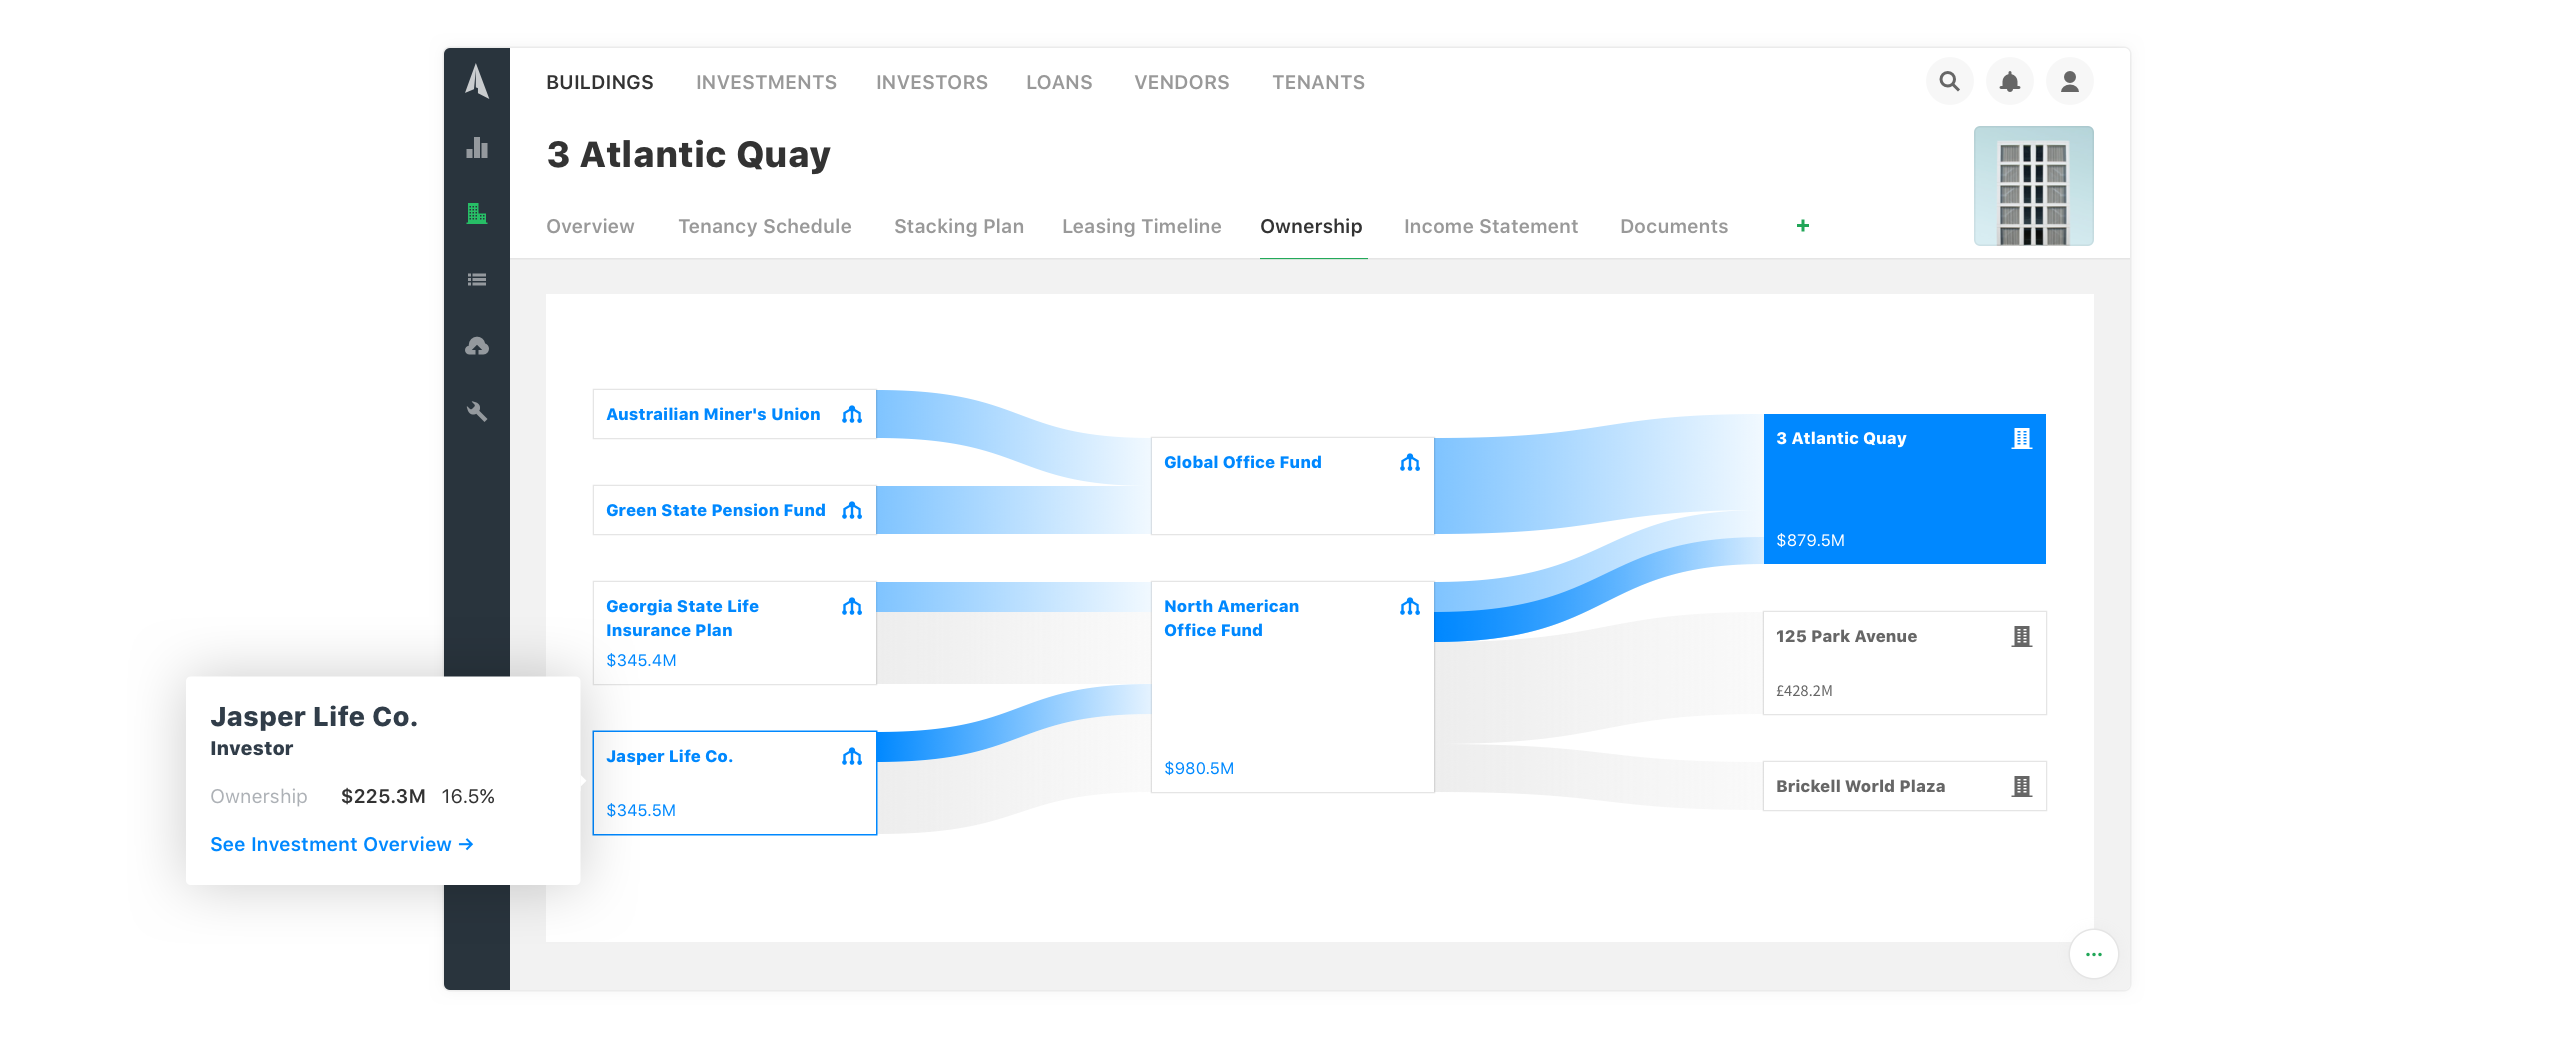
Ownership: A visual representation of the equity participation for a given asset. This ownership structure allows users to explore and model their investments.
Outcome
The new reporting framework has been well received by existing users and prospective users.