
Select Work
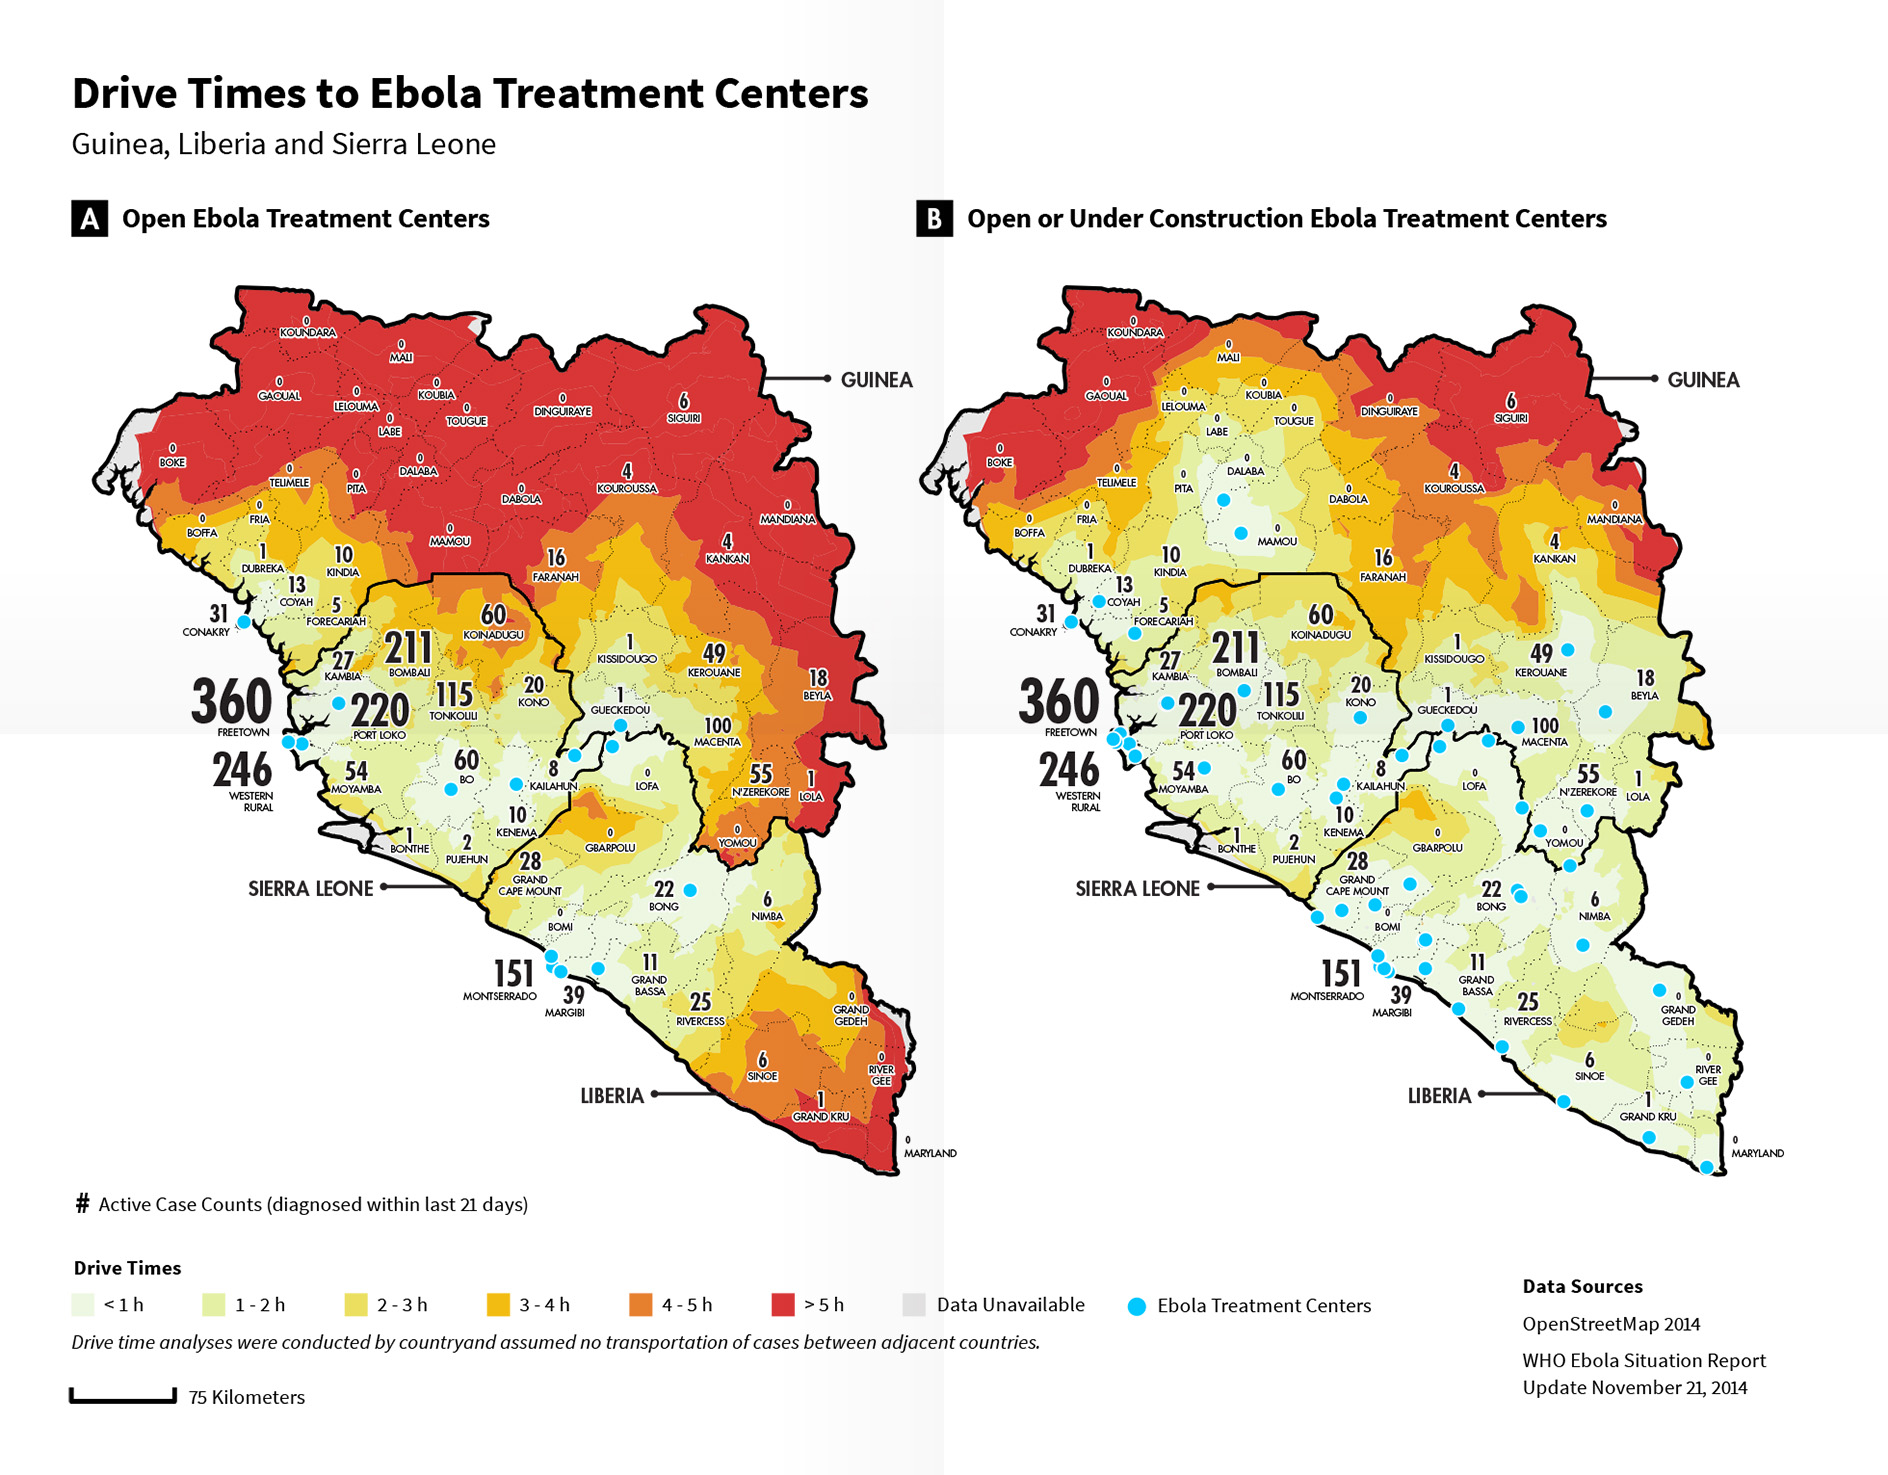
To aid the ground efforts during the 2014 West African Ebola outbreak, BlueDot produced a drive-time analysis to identify at-risk populations with limited access to Ebola treatment centres. I worked with public health analysts and geospatial engineers to effectively show relationship between road network data and reported Ebola incidence rates.
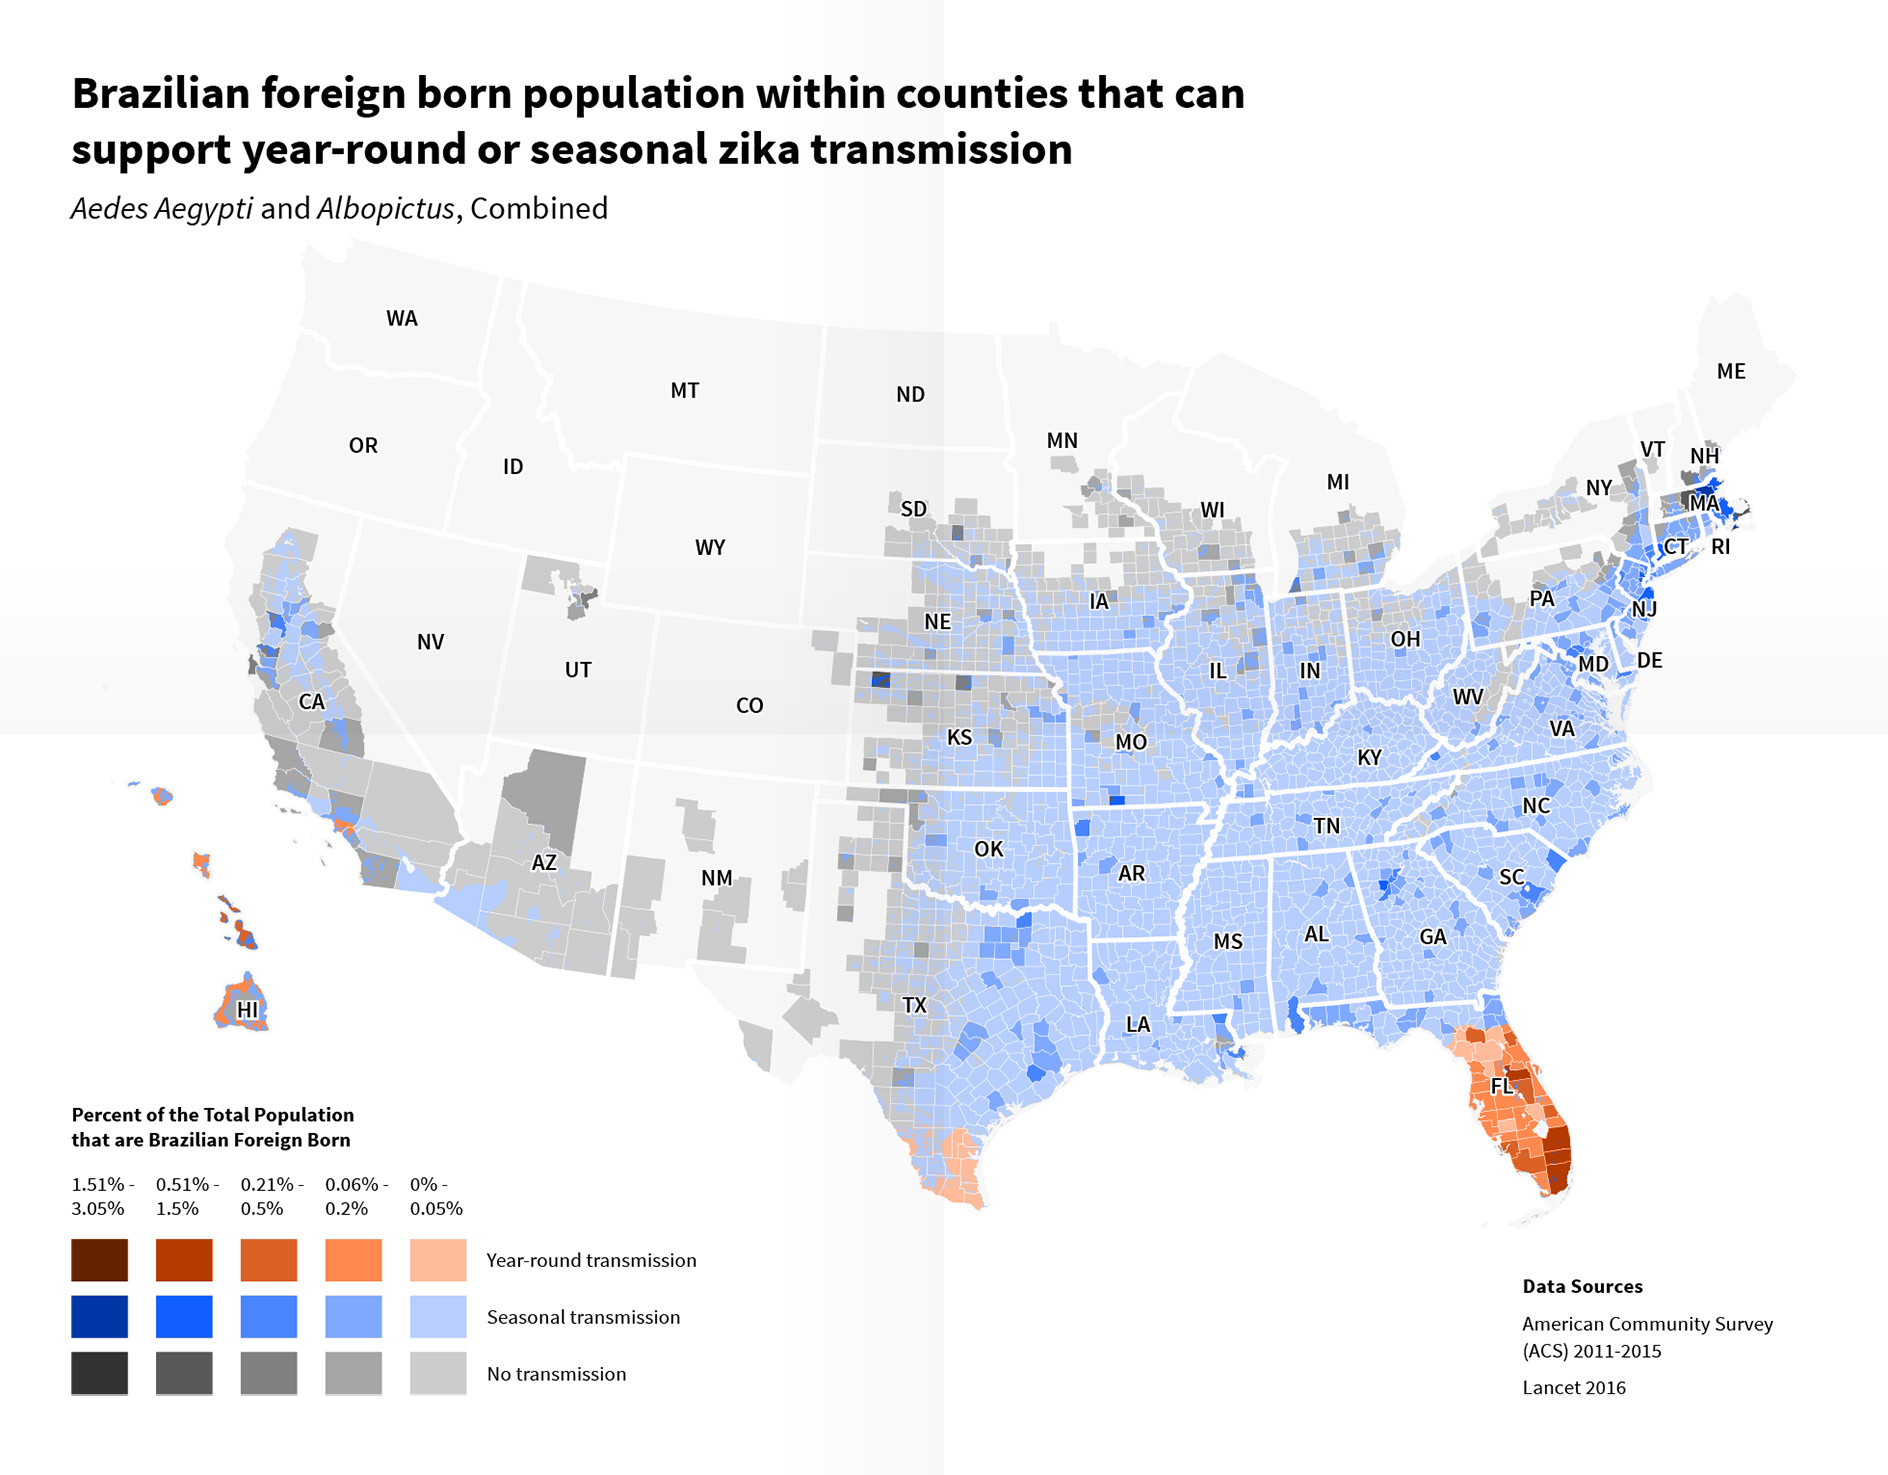
In response to the 2016 Zika virus epidemic, BlueDot produced a series of analysis to help decision-makers prepare for the potential translocation risk. The Zika virus epidemic was particularly worrisome because the long-term consequences are yet to be fully understood. Health officials worldwide voiced concerns that the Zika Outbreak in Brazil and the 2016 Rio de Janeiro Olympic games could create a perfect storm.
Working with the public health analysts and epidemiologists, we identified data sources to access the translocation risk of Zika virus to countries participating in the 2016 Brazilian Olympic Games. I visualized the data using D3.js, allowing a user to switch between several variables and explore multiple perspectives.
The success of these analyses prompted me and a geospatial analyst to lead workshop training sessions teaching government public health agencies data visualisation methods and techniques.